Fowl aviadenovirus 11
Taxonomy: Viruses; Varidnaviria; Bamfordvirae; Preplasmiviricota; Tectiliviricetes; Rowavirales; Adenoviridae; Aviadenovirus; Fowl aviadenovirus D
Average proteome isoelectric point is 6.35
Get precalculated fractions of proteins
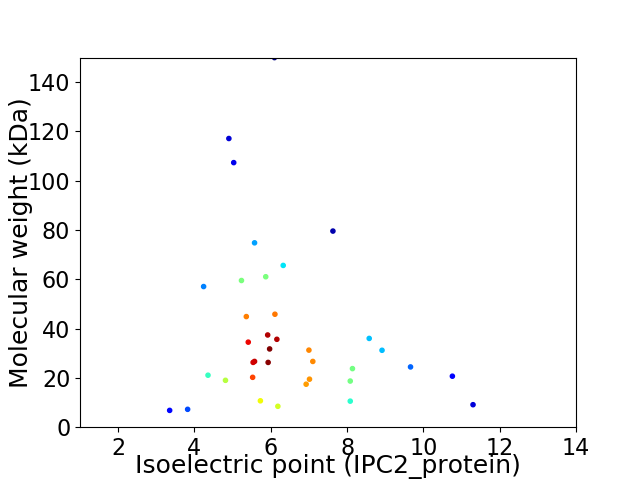
Virtual 2D-PAGE plot for 37 proteins (isoelectric point calculated using IPC2_protein)
Get csv file with sequences according to given criteria:
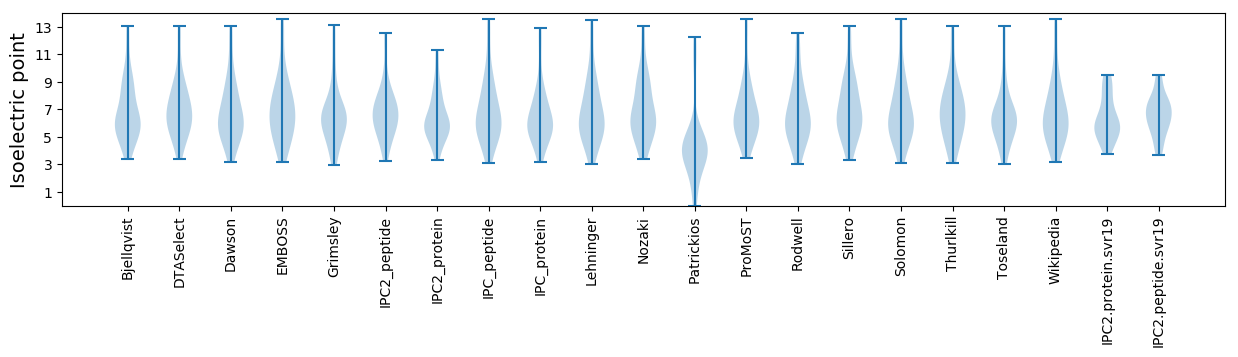
* You can choose from 21 different methods for calculating isoelectric point
Summary statistics related to proteome-wise predictions
Protein with the lowest isoelectric point:
>tr|A0A191UM48|A0A191UM48_9ADEN ORF14A OS=Fowl aviadenovirus 11 OX=172857 PE=4 SV=1
MM1 pKa = 7.24VKK3 pKa = 9.74TGISEE8 pKa = 4.06AAKK11 pKa = 10.58LFATIDD17 pKa = 3.59DD18 pKa = 4.15MSIEE22 pKa = 4.12DD23 pKa = 3.66WFLVFVVFFAILSFLWGMFLGLLCGPGDD51 pKa = 4.78LDD53 pKa = 4.07FAGYY57 pKa = 8.57WGLVFPCLL65 pKa = 3.97
MM1 pKa = 7.24VKK3 pKa = 9.74TGISEE8 pKa = 4.06AAKK11 pKa = 10.58LFATIDD17 pKa = 3.59DD18 pKa = 4.15MSIEE22 pKa = 4.12DD23 pKa = 3.66WFLVFVVFFAILSFLWGMFLGLLCGPGDD51 pKa = 4.78LDD53 pKa = 4.07FAGYY57 pKa = 8.57WGLVFPCLL65 pKa = 3.97
Molecular weight: 7.25 kDa
Isoelectric point according different methods:
Protein with the highest isoelectric point:
>tr|A0A191UM63|A0A191UM63_9ADEN Protease OS=Fowl aviadenovirus 11 OX=172857 GN=L3 PE=2 SV=1
MM1 pKa = 7.68SILISPNDD9 pKa = 3.25NRR11 pKa = 11.84GWGMRR16 pKa = 11.84RR17 pKa = 11.84RR18 pKa = 11.84SRR20 pKa = 11.84SSMRR24 pKa = 11.84GVGIRR29 pKa = 11.84RR30 pKa = 11.84RR31 pKa = 11.84RR32 pKa = 11.84LTLRR36 pKa = 11.84TLLGLGTSSRR46 pKa = 11.84RR47 pKa = 11.84RR48 pKa = 11.84SGGRR52 pKa = 11.84SSRR55 pKa = 11.84RR56 pKa = 11.84RR57 pKa = 11.84SRR59 pKa = 11.84PASTTTRR66 pKa = 11.84VMLVRR71 pKa = 11.84TSRR74 pKa = 11.84RR75 pKa = 11.84RR76 pKa = 11.84RR77 pKa = 11.84RR78 pKa = 3.32
MM1 pKa = 7.68SILISPNDD9 pKa = 3.25NRR11 pKa = 11.84GWGMRR16 pKa = 11.84RR17 pKa = 11.84RR18 pKa = 11.84SRR20 pKa = 11.84SSMRR24 pKa = 11.84GVGIRR29 pKa = 11.84RR30 pKa = 11.84RR31 pKa = 11.84RR32 pKa = 11.84LTLRR36 pKa = 11.84TLLGLGTSSRR46 pKa = 11.84RR47 pKa = 11.84RR48 pKa = 11.84SGGRR52 pKa = 11.84SSRR55 pKa = 11.84RR56 pKa = 11.84RR57 pKa = 11.84SRR59 pKa = 11.84PASTTTRR66 pKa = 11.84VMLVRR71 pKa = 11.84TSRR74 pKa = 11.84RR75 pKa = 11.84RR76 pKa = 11.84RR77 pKa = 11.84RR78 pKa = 3.32
Molecular weight: 9.12 kDa
Isoelectric point according different methods:
Peptides (in silico digests for buttom-up proteomics)
Below you can find in silico digests of the whole proteome with Trypsin, Chymotrypsin, Trypsin+LysC, LysN, ArgC proteases suitable for different mass spec machines.| Try ESI |
 |
|---|
| ChTry ESI |
|
|---|
| ArgC ESI |
|
|---|
| LysN ESI |
|
|---|
| TryLysC ESI |
|
|---|
| Try MALDI |
|
|---|
| ChTry MALDI |
|
|---|
| ArgC MALDI |
|
|---|
| LysN MALDI |
|
|---|
| TryLysC MALDI |
|
|---|
| Try LTQ |
|
|---|
| ChTry LTQ |
|
|---|
| ArgC LTQ |
|
|---|
| LysN LTQ |
|
|---|
| TryLysC LTQ |
|
|---|
| Try MSlow |
|
|---|
| ChTry MSlow |
|
|---|
| ArgC MSlow |
|
|---|
| LysN MSlow |
|
|---|
| TryLysC MSlow |
|
|---|
| Try MShigh |
|
|---|
| ChTry MShigh |
|
|---|
| ArgC MShigh |
|
|---|
| LysN MShigh |
|
|---|
| TryLysC MShigh |
|
|---|
General Statistics
Number of major isoforms |
Number of additional isoforms |
Number of all proteins |
Number of amino acids |
Min. Seq. Length |
Max. Seq. Length |
Avg. Seq. Length |
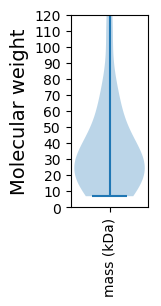
Avg. Mol. Weight |
|---|---|---|---|---|---|---|---|
12842 |
65 |
1305 |
347.1 |
39.01 |
Amino acid frequency
Ala |
Cys |
Asp |
Glu |
Phe |
Gly |
His |
Ile |
Lys |
Leu |
|---|---|---|---|---|---|---|---|---|---|
8.044 ± 0.382 | 1.861 ± 0.248 |
5.607 ± 0.259 | 6.191 ± 0.444 |
4.221 ± 0.204 | 6.175 ± 0.295 |
2.289 ± 0.226 | 3.956 ± 0.157 |
3.699 ± 0.28 | 8.737 ± 0.334 |
Met |
Asn |
Gln |
Pro |
Arg |
Ser |
Thr |
Val |
Trp |
Tyr |
|---|---|---|---|---|---|---|---|---|---|
2.391 ± 0.168 | 4.189 ± 0.383 |
6.58 ± 0.253 | 3.598 ± 0.227 |
7.304 ± 0.48 | 7.172 ± 0.395 |
6.082 ± 0.277 | 6.541 ± 0.306 |
1.363 ± 0.108 | 4.002 ± 0.297 |
Most of the basic statistics you can see at this page can be downloaded from this CSV file
See this proteome in:

Proteome-pI is available under Creative Commons Attribution-NoDerivs license, for more details see here
| Reference: Kozlowski LP. Proteome-pI 2.0: Proteome Isoelectric Point Database Update. Nucleic Acids Res. 2021, doi: 10.1093/nar/gkab944 | Contact: Lukasz P. Kozlowski |