Pseudomonas phage Littlefix
Taxonomy: Viruses; Duplodnaviria; Heunggongvirae; Uroviricota; Caudoviricetes; Caudovirales; Schitoviridae; Littlefixvirus; Pseudomonas virus Littlefix
Average proteome isoelectric point is 6.26
Get precalculated fractions of proteins
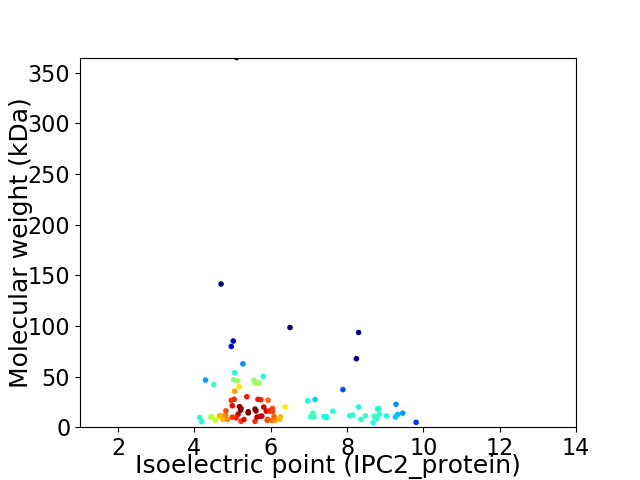
Virtual 2D-PAGE plot for 95 proteins (isoelectric point calculated using IPC2_protein)
Get csv file with sequences according to given criteria:
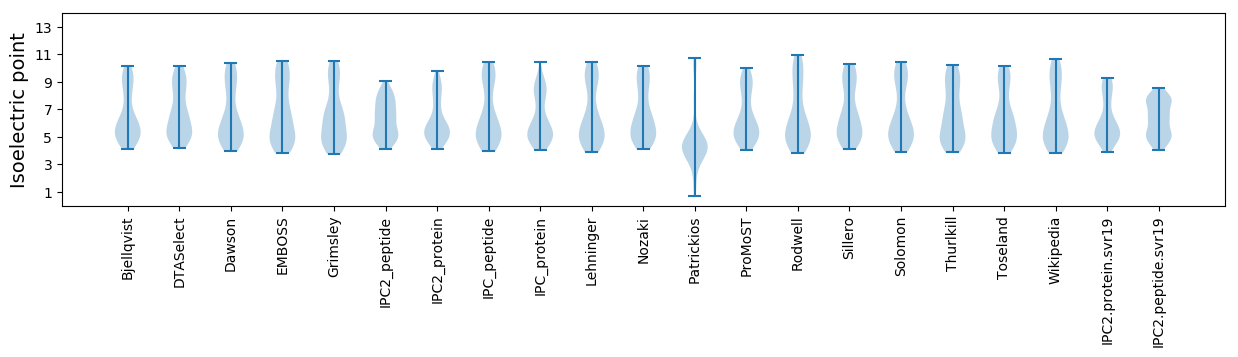
* You can choose from 21 different methods for calculating isoelectric point
Summary statistics related to proteome-wise predictions
Protein with the lowest isoelectric point:
>tr|A0A2K9VHS9|A0A2K9VHS9_9CAUD DNA polymerase OS=Pseudomonas phage Littlefix OX=2079289 GN=PsPhLittlefix_gp78 PE=3 SV=1
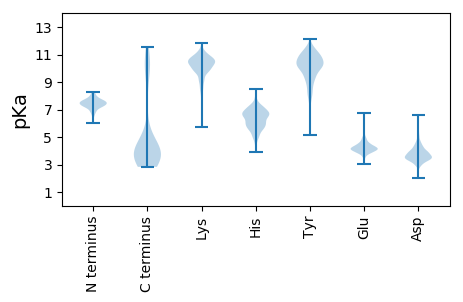
MM1 pKa = 8.28DD2 pKa = 4.28DD3 pKa = 4.14HH4 pKa = 6.78EE5 pKa = 4.92LAAEE9 pKa = 4.14MVSEE13 pKa = 3.85ILEE16 pKa = 4.3NDD18 pKa = 3.3EE19 pKa = 4.08LLYY22 pKa = 10.52MIGHH26 pKa = 6.45SGGPNPPYY34 pKa = 9.8EE35 pKa = 4.02RR36 pKa = 11.84HH37 pKa = 6.03AEE39 pKa = 4.28IISVTPEE46 pKa = 3.74TLGG49 pKa = 3.53
MM1 pKa = 8.28DD2 pKa = 4.28DD3 pKa = 4.14HH4 pKa = 6.78EE5 pKa = 4.92LAAEE9 pKa = 4.14MVSEE13 pKa = 3.85ILEE16 pKa = 4.3NDD18 pKa = 3.3EE19 pKa = 4.08LLYY22 pKa = 10.52MIGHH26 pKa = 6.45SGGPNPPYY34 pKa = 9.8EE35 pKa = 4.02RR36 pKa = 11.84HH37 pKa = 6.03AEE39 pKa = 4.28IISVTPEE46 pKa = 3.74TLGG49 pKa = 3.53
Molecular weight: 5.42 kDa
Isoelectric point according different methods:
Protein with the highest isoelectric point:
>tr|A0A2K9VHN8|A0A2K9VHN8_9CAUD Uncharacterized protein OS=Pseudomonas phage Littlefix OX=2079289 GN=PsPhLittlefix_gp48 PE=4 SV=1
MM1 pKa = 7.52QFRR4 pKa = 11.84NKK6 pKa = 9.71LALAIYY12 pKa = 9.3YY13 pKa = 10.04AYY15 pKa = 10.31NKK17 pKa = 10.06NMWEE21 pKa = 4.02HH22 pKa = 5.13VRR24 pKa = 11.84VVRR27 pKa = 11.84EE28 pKa = 3.81PSWFDD33 pKa = 3.01VRR35 pKa = 11.84RR36 pKa = 11.84ISS38 pKa = 4.02
MM1 pKa = 7.52QFRR4 pKa = 11.84NKK6 pKa = 9.71LALAIYY12 pKa = 9.3YY13 pKa = 10.04AYY15 pKa = 10.31NKK17 pKa = 10.06NMWEE21 pKa = 4.02HH22 pKa = 5.13VRR24 pKa = 11.84VVRR27 pKa = 11.84EE28 pKa = 3.81PSWFDD33 pKa = 3.01VRR35 pKa = 11.84RR36 pKa = 11.84ISS38 pKa = 4.02
Molecular weight: 4.79 kDa
Isoelectric point according different methods:
Peptides (in silico digests for buttom-up proteomics)
Below you can find in silico digests of the whole proteome with Trypsin, Chymotrypsin, Trypsin+LysC, LysN, ArgC proteases suitable for different mass spec machines.| Try ESI |
 |
|---|
| ChTry ESI |
|
|---|
| ArgC ESI |
|
|---|
| LysN ESI |
|
|---|
| TryLysC ESI |
|
|---|
| Try MALDI |
|
|---|
| ChTry MALDI |
|
|---|
| ArgC MALDI |
|
|---|
| LysN MALDI |
|
|---|
| TryLysC MALDI |
|
|---|
| Try LTQ |
|
|---|
| ChTry LTQ |
|
|---|
| ArgC LTQ |
|
|---|
| LysN LTQ |
|
|---|
| TryLysC LTQ |
|
|---|
| Try MSlow |
|
|---|
| ChTry MSlow |
|
|---|
| ArgC MSlow |
|
|---|
| LysN MSlow |
|
|---|
| TryLysC MSlow |
|
|---|
| Try MShigh |
|
|---|
| ChTry MShigh |
|
|---|
| ArgC MShigh |
|
|---|
| LysN MShigh |
|
|---|
| TryLysC MShigh |
|
|---|
General Statistics
Number of major isoforms |
Number of additional isoforms |
Number of all proteins |
Number of amino acids |
Min. Seq. Length |
Max. Seq. Length |
Avg. Seq. Length |
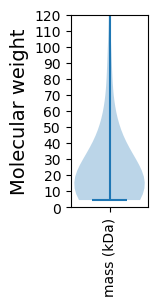
Avg. Mol. Weight |
|---|---|---|---|---|---|---|---|
0 |
23013 |
38 |
3369 |
242.2 |
26.83 |
Amino acid frequency
Ala |
Cys |
Asp |
Glu |
Phe |
Gly |
His |
Ile |
Lys |
Leu |
|---|---|---|---|---|---|---|---|---|---|
9.834 ± 0.625 | 0.834 ± 0.15 |
6.153 ± 0.188 | 6.375 ± 0.232 |
3.411 ± 0.159 | 6.831 ± 0.277 |
1.938 ± 0.178 | 5.132 ± 0.272 |
6.357 ± 0.31 | 8.408 ± 0.231 |
Met |
Asn |
Gln |
Pro |
Arg |
Ser |
Thr |
Val |
Trp |
Tyr |
|---|---|---|---|---|---|---|---|---|---|
3.085 ± 0.181 | 4.602 ± 0.207 |
4.298 ± 0.24 | 4.528 ± 0.228 |
4.55 ± 0.185 | 5.666 ± 0.217 |
6.305 ± 0.314 | 7.131 ± 0.173 |
1.204 ± 0.143 | 3.359 ± 0.211 |
Most of the basic statistics you can see at this page can be downloaded from this CSV file
See this proteome in:

Proteome-pI is available under Creative Commons Attribution-NoDerivs license, for more details see here
| Reference: Kozlowski LP. Proteome-pI 2.0: Proteome Isoelectric Point Database Update. Nucleic Acids Res. 2021, doi: 10.1093/nar/gkab944 | Contact: Lukasz P. Kozlowski |