Ahrensia sp. R2A130
Taxonomy: cellular organisms; Bacteria; Proteobacteria; Alphaproteobacteria; Hyphomicrobiales; Ahrensiaceae; Ahrensia; unclassified Ahrensia
Average proteome isoelectric point is 6.21
Get precalculated fractions of proteins
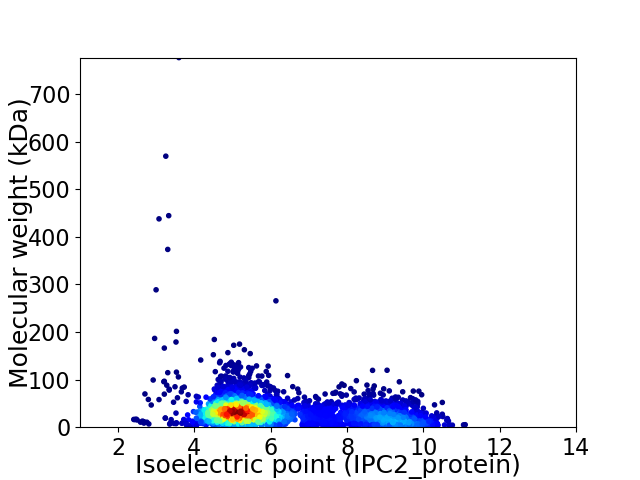
Virtual 2D-PAGE plot for 3622 proteins (isoelectric point calculated using IPC2_protein)
Get csv file with sequences according to given criteria:
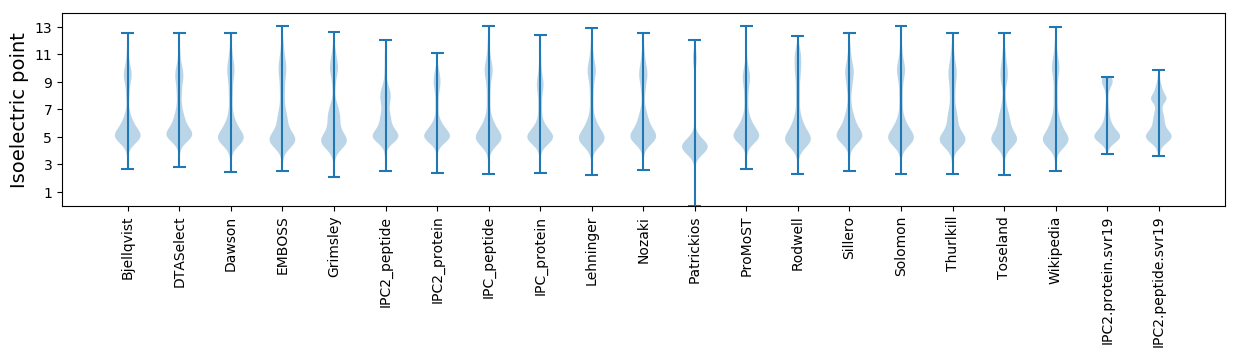
* You can choose from 21 different methods for calculating isoelectric point
Summary statistics related to proteome-wise predictions
Protein with the lowest isoelectric point:
>tr|E0MJH6|E0MJH6_9RHOB Uncharacterized protein OS=Ahrensia sp. R2A130 OX=744979 GN=R2A130_0040 PE=4 SV=1
MM1 pKa = 7.48HH2 pKa = 7.89ALKK5 pKa = 10.46QEE7 pKa = 4.18QFCTDD12 pKa = 3.23ITPAQAFLASDD23 pKa = 4.23PASVACDD30 pKa = 3.44VMDD33 pKa = 3.38MWTEE37 pKa = 4.11DD38 pKa = 2.93GTLIVISADD47 pKa = 3.34ALPSATLQGLQNCWLNGDD65 pKa = 3.77VEE67 pKa = 4.96AYY69 pKa = 10.35RR70 pKa = 11.84AMDD73 pKa = 3.22MMGG76 pKa = 2.99
MM1 pKa = 7.48HH2 pKa = 7.89ALKK5 pKa = 10.46QEE7 pKa = 4.18QFCTDD12 pKa = 3.23ITPAQAFLASDD23 pKa = 4.23PASVACDD30 pKa = 3.44VMDD33 pKa = 3.38MWTEE37 pKa = 4.11DD38 pKa = 2.93GTLIVISADD47 pKa = 3.34ALPSATLQGLQNCWLNGDD65 pKa = 3.77VEE67 pKa = 4.96AYY69 pKa = 10.35RR70 pKa = 11.84AMDD73 pKa = 3.22MMGG76 pKa = 2.99
Molecular weight: 8.23 kDa
Isoelectric point according different methods:
Protein with the highest isoelectric point:
>tr|E0MR67|E0MR67_9RHOB Uncharacterized protein OS=Ahrensia sp. R2A130 OX=744979 GN=R2A130_2910 PE=4 SV=1
MM1 pKa = 7.32KK2 pKa = 10.26VKK4 pKa = 10.85NSLRR8 pKa = 11.84SLKK11 pKa = 10.09GRR13 pKa = 11.84HH14 pKa = 4.78RR15 pKa = 11.84ANRR18 pKa = 11.84LVRR21 pKa = 11.84RR22 pKa = 11.84KK23 pKa = 10.11GRR25 pKa = 11.84VYY27 pKa = 10.41IINKK31 pKa = 7.68VNPRR35 pKa = 11.84FKK37 pKa = 10.77ARR39 pKa = 11.84QGG41 pKa = 3.28
MM1 pKa = 7.32KK2 pKa = 10.26VKK4 pKa = 10.85NSLRR8 pKa = 11.84SLKK11 pKa = 10.09GRR13 pKa = 11.84HH14 pKa = 4.78RR15 pKa = 11.84ANRR18 pKa = 11.84LVRR21 pKa = 11.84RR22 pKa = 11.84KK23 pKa = 10.11GRR25 pKa = 11.84VYY27 pKa = 10.41IINKK31 pKa = 7.68VNPRR35 pKa = 11.84FKK37 pKa = 10.77ARR39 pKa = 11.84QGG41 pKa = 3.28
Molecular weight: 4.9 kDa
Isoelectric point according different methods:
Peptides (in silico digests for buttom-up proteomics)
Below you can find in silico digests of the whole proteome with Trypsin, Chymotrypsin, Trypsin+LysC, LysN, ArgC proteases suitable for different mass spec machines.| Try ESI |
 |
|---|
| ChTry ESI |
|
|---|
| ArgC ESI |
|
|---|
| LysN ESI |
|
|---|
| TryLysC ESI |
|
|---|
| Try MALDI |
|
|---|
| ChTry MALDI |
|
|---|
| ArgC MALDI |
|
|---|
| LysN MALDI |
|
|---|
| TryLysC MALDI |
|
|---|
| Try LTQ |
|
|---|
| ChTry LTQ |
|
|---|
| ArgC LTQ |
|
|---|
| LysN LTQ |
|
|---|
| TryLysC LTQ |
|
|---|
| Try MSlow |
|
|---|
| ChTry MSlow |
|
|---|
| ArgC MSlow |
|
|---|
| LysN MSlow |
|
|---|
| TryLysC MSlow |
|
|---|
| Try MShigh |
|
|---|
| ChTry MShigh |
|
|---|
| ArgC MShigh |
|
|---|
| LysN MShigh |
|
|---|
| TryLysC MShigh |
|
|---|
General Statistics
Number of major isoforms |
Number of additional isoforms |
Number of all proteins |
Number of amino acids |
Min. Seq. Length |
Max. Seq. Length |
Avg. Seq. Length |
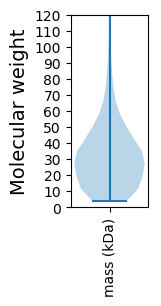
Avg. Mol. Weight |
|---|---|---|---|---|---|---|---|
0 |
1133679 |
37 |
7333 |
313.0 |
33.96 |
Amino acid frequency
Ala |
Cys |
Asp |
Glu |
Phe |
Gly |
His |
Ile |
Lys |
Leu |
|---|---|---|---|---|---|---|---|---|---|
11.64 ± 0.067 | 0.86 ± 0.015 |
6.398 ± 0.077 | 5.807 ± 0.046 |
3.886 ± 0.028 | 8.515 ± 0.064 |
1.981 ± 0.028 | 5.461 ± 0.035 |
3.797 ± 0.048 | 9.363 ± 0.056 |
Met |
Asn |
Gln |
Pro |
Arg |
Ser |
Thr |
Val |
Trp |
Tyr |
|---|---|---|---|---|---|---|---|---|---|
2.77 ± 0.033 | 3.152 ± 0.036 |
4.706 ± 0.032 | 3.134 ± 0.028 |
6.034 ± 0.061 | 5.775 ± 0.032 |
5.92 ± 0.065 | 7.339 ± 0.04 |
1.298 ± 0.019 | 2.164 ± 0.018 |
Most of the basic statistics you can see at this page can be downloaded from this CSV file
See this proteome in:

Proteome-pI is available under Creative Commons Attribution-NoDerivs license, for more details see here
| Reference: Kozlowski LP. Proteome-pI 2.0: Proteome Isoelectric Point Database Update. Nucleic Acids Res. 2021, doi: 10.1093/nar/gkab944 | Contact: Lukasz P. Kozlowski |