Eubacterium sp. CAG:274
Taxonomy: cellular organisms; Bacteria; Terrabacteria group; Firmicutes; Clostridia; Eubacteriales; Eubacteriaceae; Eubacterium; environmental samples
Average proteome isoelectric point is 6.18
Get precalculated fractions of proteins
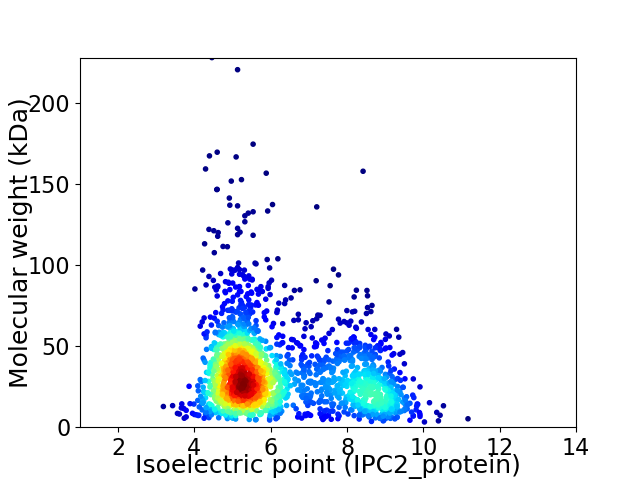
Virtual 2D-PAGE plot for 2006 proteins (isoelectric point calculated using IPC2_protein)
Get csv file with sequences according to given criteria:
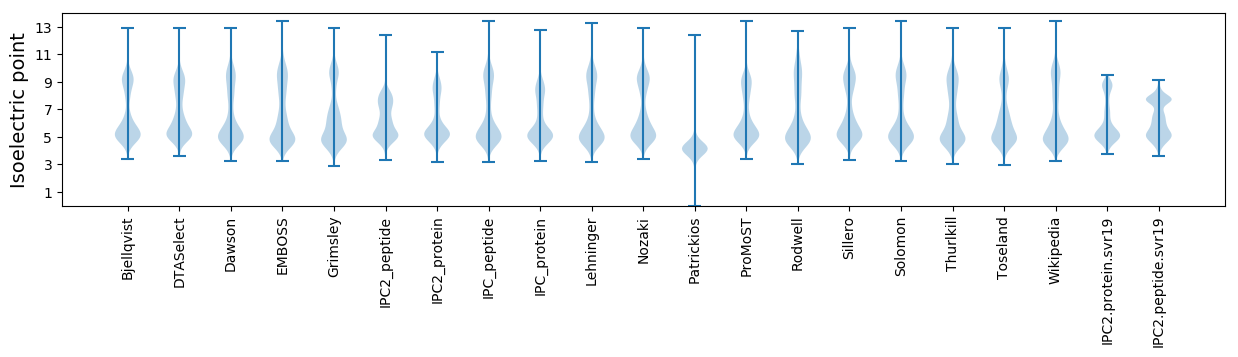
* You can choose from 21 different methods for calculating isoelectric point
Summary statistics related to proteome-wise predictions
Protein with the lowest isoelectric point:
>tr|R6PGW5|R6PGW5_9FIRM Uncharacterized protein OS=Eubacterium sp. CAG:274 OX=1262888 GN=BN582_00567 PE=4 SV=1
MM1 pKa = 7.82RR2 pKa = 11.84IEE4 pKa = 4.87PEE6 pKa = 3.97LTYY9 pKa = 10.54QDD11 pKa = 3.6YY12 pKa = 11.09RR13 pKa = 11.84DD14 pKa = 4.05GVEE17 pKa = 3.65HH18 pKa = 6.82CFDD21 pKa = 3.95YY22 pKa = 11.16LGSKK26 pKa = 10.08HH27 pKa = 6.48FEE29 pKa = 4.0TADD32 pKa = 3.93TITDD36 pKa = 3.41WMADD40 pKa = 3.57EE41 pKa = 6.32DD42 pKa = 5.28DD43 pKa = 5.01DD44 pKa = 6.25LLVADD49 pKa = 4.57STSLAII55 pKa = 4.95
MM1 pKa = 7.82RR2 pKa = 11.84IEE4 pKa = 4.87PEE6 pKa = 3.97LTYY9 pKa = 10.54QDD11 pKa = 3.6YY12 pKa = 11.09RR13 pKa = 11.84DD14 pKa = 4.05GVEE17 pKa = 3.65HH18 pKa = 6.82CFDD21 pKa = 3.95YY22 pKa = 11.16LGSKK26 pKa = 10.08HH27 pKa = 6.48FEE29 pKa = 4.0TADD32 pKa = 3.93TITDD36 pKa = 3.41WMADD40 pKa = 3.57EE41 pKa = 6.32DD42 pKa = 5.28DD43 pKa = 5.01DD44 pKa = 6.25LLVADD49 pKa = 4.57STSLAII55 pKa = 4.95
Molecular weight: 6.36 kDa
Isoelectric point according different methods:
Protein with the highest isoelectric point:
>tr|R6P996|R6P996_9FIRM tRNA modification GTPase MnmE OS=Eubacterium sp. CAG:274 OX=1262888 GN=mnmE PE=3 SV=1
MM1 pKa = 7.67KK2 pKa = 8.72MTFQPKK8 pKa = 8.79KK9 pKa = 7.6RR10 pKa = 11.84QRR12 pKa = 11.84AKK14 pKa = 9.33VHH16 pKa = 5.63GFRR19 pKa = 11.84KK20 pKa = 10.02RR21 pKa = 11.84MSTANGRR28 pKa = 11.84KK29 pKa = 8.96VLLARR34 pKa = 11.84RR35 pKa = 11.84RR36 pKa = 11.84KK37 pKa = 9.07GRR39 pKa = 11.84KK40 pKa = 9.04ALTAA44 pKa = 4.17
MM1 pKa = 7.67KK2 pKa = 8.72MTFQPKK8 pKa = 8.79KK9 pKa = 7.6RR10 pKa = 11.84QRR12 pKa = 11.84AKK14 pKa = 9.33VHH16 pKa = 5.63GFRR19 pKa = 11.84KK20 pKa = 10.02RR21 pKa = 11.84MSTANGRR28 pKa = 11.84KK29 pKa = 8.96VLLARR34 pKa = 11.84RR35 pKa = 11.84RR36 pKa = 11.84KK37 pKa = 9.07GRR39 pKa = 11.84KK40 pKa = 9.04ALTAA44 pKa = 4.17
Molecular weight: 5.2 kDa
Isoelectric point according different methods:
Peptides (in silico digests for buttom-up proteomics)
Below you can find in silico digests of the whole proteome with Trypsin, Chymotrypsin, Trypsin+LysC, LysN, ArgC proteases suitable for different mass spec machines.| Try ESI |
 |
|---|
| ChTry ESI |
|
|---|
| ArgC ESI |
|
|---|
| LysN ESI |
|
|---|
| TryLysC ESI |
|
|---|
| Try MALDI |
|
|---|
| ChTry MALDI |
|
|---|
| ArgC MALDI |
|
|---|
| LysN MALDI |
|
|---|
| TryLysC MALDI |
|
|---|
| Try LTQ |
|
|---|
| ChTry LTQ |
|
|---|
| ArgC LTQ |
|
|---|
| LysN LTQ |
|
|---|
| TryLysC LTQ |
|
|---|
| Try MSlow |
|
|---|
| ChTry MSlow |
|
|---|
| ArgC MSlow |
|
|---|
| LysN MSlow |
|
|---|
| TryLysC MSlow |
|
|---|
| Try MShigh |
|
|---|
| ChTry MShigh |
|
|---|
| ArgC MShigh |
|
|---|
| LysN MShigh |
|
|---|
| TryLysC MShigh |
|
|---|
General Statistics
Number of major isoforms |
Number of additional isoforms |
Number of all proteins |
Number of amino acids |
Min. Seq. Length |
Max. Seq. Length |
Avg. Seq. Length |
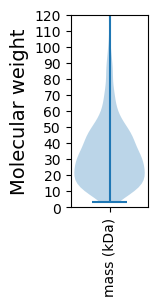
Avg. Mol. Weight |
|---|---|---|---|---|---|---|---|
0 |
633728 |
29 |
2121 |
315.9 |
35.29 |
Amino acid frequency
Ala |
Cys |
Asp |
Glu |
Phe |
Gly |
His |
Ile |
Lys |
Leu |
|---|---|---|---|---|---|---|---|---|---|
6.646 ± 0.056 | 1.457 ± 0.023 |
5.911 ± 0.045 | 6.92 ± 0.059 |
4.17 ± 0.041 | 6.838 ± 0.056 |
1.338 ± 0.022 | 8.455 ± 0.058 |
8.14 ± 0.051 | 8.085 ± 0.055 |
Met |
Asn |
Gln |
Pro |
Arg |
Ser |
Thr |
Val |
Trp |
Tyr |
|---|---|---|---|---|---|---|---|---|---|
2.785 ± 0.027 | 6.16 ± 0.053 |
2.972 ± 0.028 | 2.463 ± 0.029 |
3.276 ± 0.036 | 6.211 ± 0.049 |
5.928 ± 0.068 | 7.386 ± 0.049 |
0.667 ± 0.015 | 4.194 ± 0.041 |
Most of the basic statistics you can see at this page can be downloaded from this CSV file
See this proteome in:

Proteome-pI is available under Creative Commons Attribution-NoDerivs license, for more details see here
| Reference: Kozlowski LP. Proteome-pI 2.0: Proteome Isoelectric Point Database Update. Nucleic Acids Res. 2021, doi: 10.1093/nar/gkab944 | Contact: Lukasz P. Kozlowski |