Gordonia phage Kita
Taxonomy: Viruses; Duplodnaviria; Heunggongvirae; Uroviricota; Caudoviricetes; Caudovirales; Siphoviridae; Nymbaxtervirinae; Nymphadoravirus; Gordonia virus Kita
Average proteome isoelectric point is 6.41
Get precalculated fractions of proteins
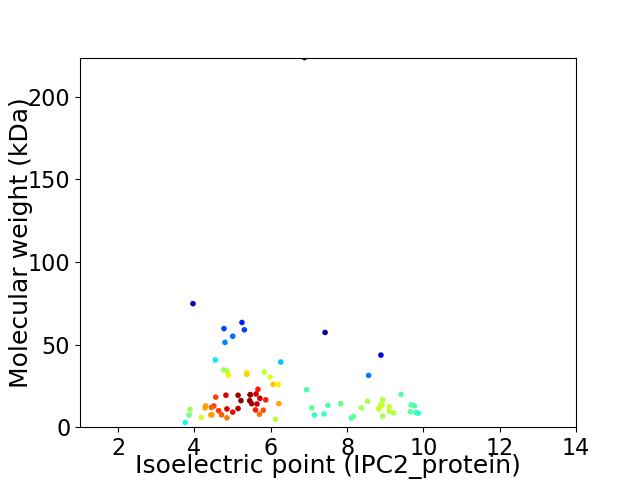
Virtual 2D-PAGE plot for 80 proteins (isoelectric point calculated using IPC2_protein)
Get csv file with sequences according to given criteria:
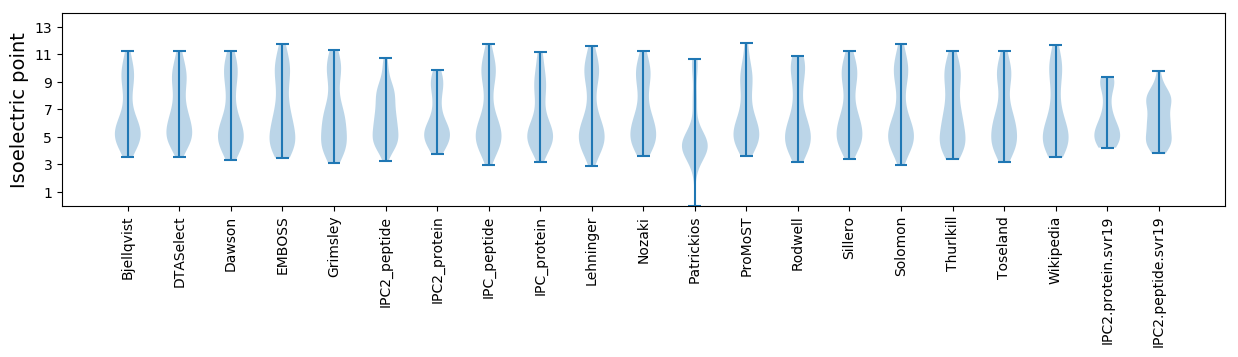
* You can choose from 21 different methods for calculating isoelectric point
Summary statistics related to proteome-wise predictions
Protein with the lowest isoelectric point:
>tr|A0A142KB66|A0A142KB66_9CAUD Uncharacterized protein OS=Gordonia phage Kita OX=1821556 GN=36 PE=4 SV=1
MM1 pKa = 7.53LLDD4 pKa = 3.47ILAIIVCLVAACWLIATAPDD24 pKa = 4.28LYY26 pKa = 11.37
MM1 pKa = 7.53LLDD4 pKa = 3.47ILAIIVCLVAACWLIATAPDD24 pKa = 4.28LYY26 pKa = 11.37
Molecular weight: 2.82 kDa
Isoelectric point according different methods:
Protein with the highest isoelectric point:
>tr|A0A142KB40|A0A142KB40_9CAUD Uncharacterized protein OS=Gordonia phage Kita OX=1821556 GN=10 PE=4 SV=1
MM1 pKa = 7.91RR2 pKa = 11.84APLTRR7 pKa = 11.84SRR9 pKa = 11.84LSMADD14 pKa = 3.17LLARR18 pKa = 11.84FFTQPFTVRR27 pKa = 11.84RR28 pKa = 11.84KK29 pKa = 8.31TGDD32 pKa = 3.38GAVGPIYY39 pKa = 10.43ADD41 pKa = 3.25PVTLQGRR48 pKa = 11.84VNATNRR54 pKa = 11.84LIIDD58 pKa = 3.51DD59 pKa = 4.68RR60 pKa = 11.84GNQVLSAAKK69 pKa = 9.23ISMSITEE76 pKa = 4.27HH77 pKa = 7.32DD78 pKa = 4.29IPTGSQVRR86 pKa = 11.84VGDD89 pKa = 4.15GPWRR93 pKa = 11.84TVIATSRR100 pKa = 11.84HH101 pKa = 5.06RR102 pKa = 11.84GGFRR106 pKa = 11.84KK107 pKa = 10.33SPDD110 pKa = 3.47YY111 pKa = 11.31YY112 pKa = 11.38SIDD115 pKa = 3.74LNN117 pKa = 3.96
MM1 pKa = 7.91RR2 pKa = 11.84APLTRR7 pKa = 11.84SRR9 pKa = 11.84LSMADD14 pKa = 3.17LLARR18 pKa = 11.84FFTQPFTVRR27 pKa = 11.84RR28 pKa = 11.84KK29 pKa = 8.31TGDD32 pKa = 3.38GAVGPIYY39 pKa = 10.43ADD41 pKa = 3.25PVTLQGRR48 pKa = 11.84VNATNRR54 pKa = 11.84LIIDD58 pKa = 3.51DD59 pKa = 4.68RR60 pKa = 11.84GNQVLSAAKK69 pKa = 9.23ISMSITEE76 pKa = 4.27HH77 pKa = 7.32DD78 pKa = 4.29IPTGSQVRR86 pKa = 11.84VGDD89 pKa = 4.15GPWRR93 pKa = 11.84TVIATSRR100 pKa = 11.84HH101 pKa = 5.06RR102 pKa = 11.84GGFRR106 pKa = 11.84KK107 pKa = 10.33SPDD110 pKa = 3.47YY111 pKa = 11.31YY112 pKa = 11.38SIDD115 pKa = 3.74LNN117 pKa = 3.96
Molecular weight: 12.94 kDa
Isoelectric point according different methods:
Peptides (in silico digests for buttom-up proteomics)
Below you can find in silico digests of the whole proteome with Trypsin, Chymotrypsin, Trypsin+LysC, LysN, ArgC proteases suitable for different mass spec machines.| Try ESI |
 |
|---|
| ChTry ESI |
|
|---|
| ArgC ESI |
|
|---|
| LysN ESI |
|
|---|
| TryLysC ESI |
|
|---|
| Try MALDI |
|
|---|
| ChTry MALDI |
|
|---|
| ArgC MALDI |
|
|---|
| LysN MALDI |
|
|---|
| TryLysC MALDI |
|
|---|
| Try LTQ |
|
|---|
| ChTry LTQ |
|
|---|
| ArgC LTQ |
|
|---|
| LysN LTQ |
|
|---|
| TryLysC LTQ |
|
|---|
| Try MSlow |
|
|---|
| ChTry MSlow |
|
|---|
| ArgC MSlow |
|
|---|
| LysN MSlow |
|
|---|
| TryLysC MSlow |
|
|---|
| Try MShigh |
|
|---|
| ChTry MShigh |
|
|---|
| ArgC MShigh |
|
|---|
| LysN MShigh |
|
|---|
| TryLysC MShigh |
|
|---|
General Statistics
Number of major isoforms |
Number of additional isoforms |
Number of all proteins |
Number of amino acids |
Min. Seq. Length |
Max. Seq. Length |
Avg. Seq. Length |
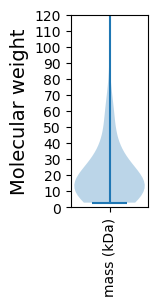
Avg. Mol. Weight |
|---|---|---|---|---|---|---|---|
0 |
16558 |
26 |
2145 |
207.0 |
22.51 |
Amino acid frequency
Ala |
Cys |
Asp |
Glu |
Phe |
Gly |
His |
Ile |
Lys |
Leu |
|---|---|---|---|---|---|---|---|---|---|
11.97 ± 0.682 | 0.755 ± 0.169 |
7.096 ± 0.397 | 5.52 ± 0.28 |
2.579 ± 0.173 | 8.346 ± 0.371 |
1.975 ± 0.23 | 4.499 ± 0.181 |
3.34 ± 0.215 | 7.537 ± 0.239 |
Met |
Asn |
Gln |
Pro |
Arg |
Ser |
Thr |
Val |
Trp |
Tyr |
|---|---|---|---|---|---|---|---|---|---|
2.102 ± 0.194 | 3.11 ± 0.201 |
5.695 ± 0.259 | 3.744 ± 0.286 |
7.561 ± 0.432 | 5.411 ± 0.215 |
7.416 ± 0.288 | 7.29 ± 0.236 |
1.86 ± 0.15 | 2.192 ± 0.143 |
Most of the basic statistics you can see at this page can be downloaded from this CSV file
See this proteome in:

Proteome-pI is available under Creative Commons Attribution-NoDerivs license, for more details see here
| Reference: Kozlowski LP. Proteome-pI 2.0: Proteome Isoelectric Point Database Update. Nucleic Acids Res. 2021, doi: 10.1093/nar/gkab944 | Contact: Lukasz P. Kozlowski |