Roseibaca ekhonensis
Taxonomy: cellular organisms; Bacteria; Proteobacteria; Alphaproteobacteria; Rhodobacterales; Rhodobacteraceae; Roseibaca
Average proteome isoelectric point is 6.3
Get precalculated fractions of proteins
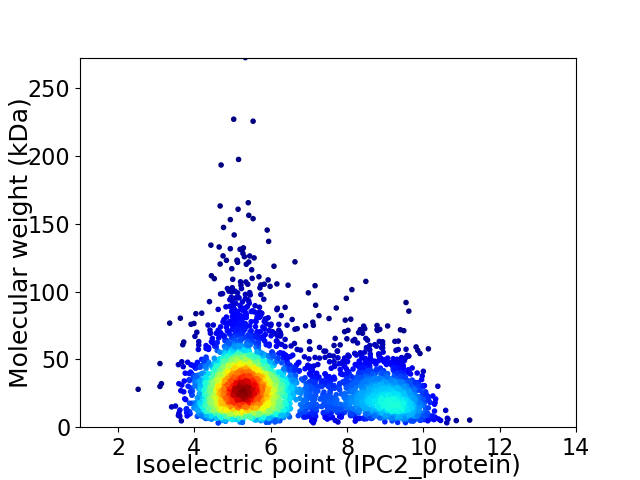
Virtual 2D-PAGE plot for 3887 proteins (isoelectric point calculated using IPC2_protein)
Get csv file with sequences according to given criteria:
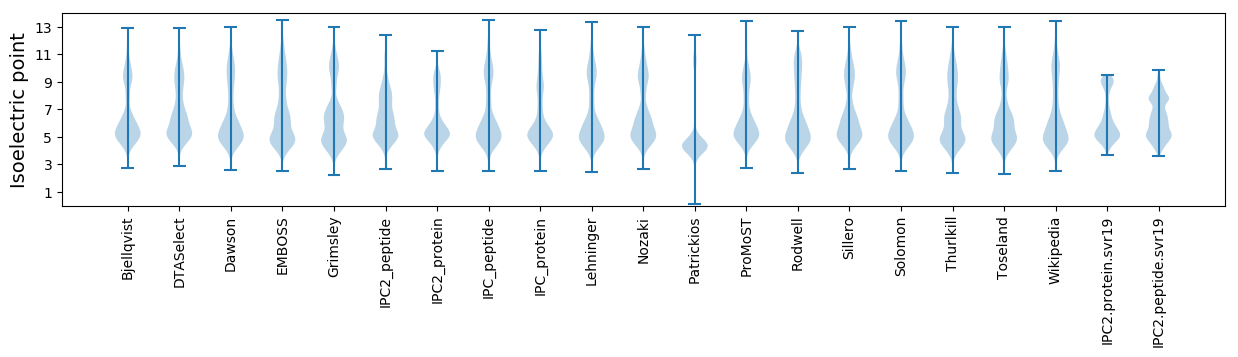
* You can choose from 21 different methods for calculating isoelectric point
Summary statistics related to proteome-wise predictions
Protein with the lowest isoelectric point:
>tr|A0A3B0MBM0|A0A3B0MBM0_9RHOB Tetrathionate reductase subunit B OS=Roseibaca ekhonensis OX=254356 GN=ttrB PE=4 SV=1
MM1 pKa = 7.45KK2 pKa = 10.11LKK4 pKa = 10.61HH5 pKa = 5.66LAAYY9 pKa = 10.1SLAAQSLALGTAFAQTPLTMWYY31 pKa = 9.31HH32 pKa = 5.69GAGNEE37 pKa = 4.07VEE39 pKa = 4.39SAIINQIVDD48 pKa = 4.35DD49 pKa = 4.79FNASQSDD56 pKa = 3.32WSVSLEE62 pKa = 4.06SFPQGAYY69 pKa = 9.97NDD71 pKa = 4.3SVVAAALAGNLPDD84 pKa = 4.5ILDD87 pKa = 3.29VDD89 pKa = 4.65GPVMPNWAWAGYY101 pKa = 7.25MQPLPLDD108 pKa = 3.6EE109 pKa = 5.35SVIADD114 pKa = 4.35FLPGTKK120 pKa = 10.12GYY122 pKa = 9.82WDD124 pKa = 3.95GEE126 pKa = 4.42LYY128 pKa = 10.91SIGLWDD134 pKa = 3.9AAVAMVARR142 pKa = 11.84QSTLDD147 pKa = 3.55ALGLRR152 pKa = 11.84TPTVAEE158 pKa = 4.09PWTGEE163 pKa = 3.9EE164 pKa = 5.13FMAALDD170 pKa = 3.84AAKK173 pKa = 9.37ATGDD177 pKa = 3.09WEE179 pKa = 4.52YY180 pKa = 11.73AFDD183 pKa = 5.96PGMAWTGEE191 pKa = 3.93WYY193 pKa = 9.24PYY195 pKa = 10.83AFSPFLQSFGGDD207 pKa = 2.53IVDD210 pKa = 3.7RR211 pKa = 11.84STYY214 pKa = 10.23QSAEE218 pKa = 3.73GVLNGDD224 pKa = 3.63AAIEE228 pKa = 4.07FGEE231 pKa = 4.1WWQSLFAEE239 pKa = 6.43GYY241 pKa = 10.97APGTSQDD248 pKa = 3.0PAARR252 pKa = 11.84DD253 pKa = 3.4NGFLEE258 pKa = 4.15GRR260 pKa = 11.84YY261 pKa = 9.68AFSWNGNWAALNALNAFDD279 pKa = 4.85DD280 pKa = 4.34TLFLPAPDD288 pKa = 4.62FGNGPKK294 pKa = 9.72IGAASWQFGVSGSSDD309 pKa = 3.6HH310 pKa = 7.41PDD312 pKa = 2.96GAAAFIEE319 pKa = 4.67FALQDD324 pKa = 3.57EE325 pKa = 4.68YY326 pKa = 11.78LAAFSNGIGLIPATASAAAMTEE348 pKa = 4.01NYY350 pKa = 10.83AEE352 pKa = 4.53GGAMAEE358 pKa = 3.99FFEE361 pKa = 5.27LSEE364 pKa = 4.21AQALVRR370 pKa = 11.84PVTPGYY376 pKa = 10.01VVQAKK381 pKa = 9.65VFEE384 pKa = 4.37KK385 pKa = 10.94ALADD389 pKa = 3.53IANGADD395 pKa = 3.38VADD398 pKa = 4.21TLDD401 pKa = 3.73AAVDD405 pKa = 4.31EE406 pKa = 4.55IDD408 pKa = 5.07ADD410 pKa = 3.63IEE412 pKa = 4.36RR413 pKa = 11.84NSGYY417 pKa = 11.02GHH419 pKa = 7.45
MM1 pKa = 7.45KK2 pKa = 10.11LKK4 pKa = 10.61HH5 pKa = 5.66LAAYY9 pKa = 10.1SLAAQSLALGTAFAQTPLTMWYY31 pKa = 9.31HH32 pKa = 5.69GAGNEE37 pKa = 4.07VEE39 pKa = 4.39SAIINQIVDD48 pKa = 4.35DD49 pKa = 4.79FNASQSDD56 pKa = 3.32WSVSLEE62 pKa = 4.06SFPQGAYY69 pKa = 9.97NDD71 pKa = 4.3SVVAAALAGNLPDD84 pKa = 4.5ILDD87 pKa = 3.29VDD89 pKa = 4.65GPVMPNWAWAGYY101 pKa = 7.25MQPLPLDD108 pKa = 3.6EE109 pKa = 5.35SVIADD114 pKa = 4.35FLPGTKK120 pKa = 10.12GYY122 pKa = 9.82WDD124 pKa = 3.95GEE126 pKa = 4.42LYY128 pKa = 10.91SIGLWDD134 pKa = 3.9AAVAMVARR142 pKa = 11.84QSTLDD147 pKa = 3.55ALGLRR152 pKa = 11.84TPTVAEE158 pKa = 4.09PWTGEE163 pKa = 3.9EE164 pKa = 5.13FMAALDD170 pKa = 3.84AAKK173 pKa = 9.37ATGDD177 pKa = 3.09WEE179 pKa = 4.52YY180 pKa = 11.73AFDD183 pKa = 5.96PGMAWTGEE191 pKa = 3.93WYY193 pKa = 9.24PYY195 pKa = 10.83AFSPFLQSFGGDD207 pKa = 2.53IVDD210 pKa = 3.7RR211 pKa = 11.84STYY214 pKa = 10.23QSAEE218 pKa = 3.73GVLNGDD224 pKa = 3.63AAIEE228 pKa = 4.07FGEE231 pKa = 4.1WWQSLFAEE239 pKa = 6.43GYY241 pKa = 10.97APGTSQDD248 pKa = 3.0PAARR252 pKa = 11.84DD253 pKa = 3.4NGFLEE258 pKa = 4.15GRR260 pKa = 11.84YY261 pKa = 9.68AFSWNGNWAALNALNAFDD279 pKa = 4.85DD280 pKa = 4.34TLFLPAPDD288 pKa = 4.62FGNGPKK294 pKa = 9.72IGAASWQFGVSGSSDD309 pKa = 3.6HH310 pKa = 7.41PDD312 pKa = 2.96GAAAFIEE319 pKa = 4.67FALQDD324 pKa = 3.57EE325 pKa = 4.68YY326 pKa = 11.78LAAFSNGIGLIPATASAAAMTEE348 pKa = 4.01NYY350 pKa = 10.83AEE352 pKa = 4.53GGAMAEE358 pKa = 3.99FFEE361 pKa = 5.27LSEE364 pKa = 4.21AQALVRR370 pKa = 11.84PVTPGYY376 pKa = 10.01VVQAKK381 pKa = 9.65VFEE384 pKa = 4.37KK385 pKa = 10.94ALADD389 pKa = 3.53IANGADD395 pKa = 3.38VADD398 pKa = 4.21TLDD401 pKa = 3.73AAVDD405 pKa = 4.31EE406 pKa = 4.55IDD408 pKa = 5.07ADD410 pKa = 3.63IEE412 pKa = 4.36RR413 pKa = 11.84NSGYY417 pKa = 11.02GHH419 pKa = 7.45
Molecular weight: 44.65 kDa
Isoelectric point according different methods:
Protein with the highest isoelectric point:
>tr|A0A3B0M734|A0A3B0M734_9RHOB Membrane-bound lytic murein transglycosylase B OS=Roseibaca ekhonensis OX=254356 GN=mltB_3 PE=4 SV=1
MM1 pKa = 7.45KK2 pKa = 9.61RR3 pKa = 11.84TFQPSNLVRR12 pKa = 11.84KK13 pKa = 8.83HH14 pKa = 4.64RR15 pKa = 11.84HH16 pKa = 3.91GFRR19 pKa = 11.84ARR21 pKa = 11.84MATKK25 pKa = 10.37AGRR28 pKa = 11.84KK29 pKa = 8.77IINARR34 pKa = 11.84RR35 pKa = 11.84RR36 pKa = 11.84MGRR39 pKa = 11.84KK40 pKa = 9.27KK41 pKa = 9.66LTAA44 pKa = 4.18
MM1 pKa = 7.45KK2 pKa = 9.61RR3 pKa = 11.84TFQPSNLVRR12 pKa = 11.84KK13 pKa = 8.83HH14 pKa = 4.64RR15 pKa = 11.84HH16 pKa = 3.91GFRR19 pKa = 11.84ARR21 pKa = 11.84MATKK25 pKa = 10.37AGRR28 pKa = 11.84KK29 pKa = 8.77IINARR34 pKa = 11.84RR35 pKa = 11.84RR36 pKa = 11.84MGRR39 pKa = 11.84KK40 pKa = 9.27KK41 pKa = 9.66LTAA44 pKa = 4.18
Molecular weight: 5.23 kDa
Isoelectric point according different methods:
Peptides (in silico digests for buttom-up proteomics)
Below you can find in silico digests of the whole proteome with Trypsin, Chymotrypsin, Trypsin+LysC, LysN, ArgC proteases suitable for different mass spec machines.| Try ESI |
 |
|---|
| ChTry ESI |
|
|---|
| ArgC ESI |
|
|---|
| LysN ESI |
|
|---|
| TryLysC ESI |
|
|---|
| Try MALDI |
|
|---|
| ChTry MALDI |
|
|---|
| ArgC MALDI |
|
|---|
| LysN MALDI |
|
|---|
| TryLysC MALDI |
|
|---|
| Try LTQ |
|
|---|
| ChTry LTQ |
|
|---|
| ArgC LTQ |
|
|---|
| LysN LTQ |
|
|---|
| TryLysC LTQ |
|
|---|
| Try MSlow |
|
|---|
| ChTry MSlow |
|
|---|
| ArgC MSlow |
|
|---|
| LysN MSlow |
|
|---|
| TryLysC MSlow |
|
|---|
| Try MShigh |
|
|---|
| ChTry MShigh |
|
|---|
| ArgC MShigh |
|
|---|
| LysN MShigh |
|
|---|
| TryLysC MShigh |
|
|---|
General Statistics
Number of major isoforms |
Number of additional isoforms |
Number of all proteins |
Number of amino acids |
Min. Seq. Length |
Max. Seq. Length |
Avg. Seq. Length |
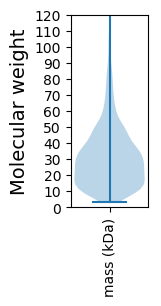
Avg. Mol. Weight |
|---|---|---|---|---|---|---|---|
0 |
1169467 |
30 |
2469 |
300.9 |
32.64 |
Amino acid frequency
Ala |
Cys |
Asp |
Glu |
Phe |
Gly |
His |
Ile |
Lys |
Leu |
|---|---|---|---|---|---|---|---|---|---|
12.972 ± 0.057 | 0.921 ± 0.014 |
6.289 ± 0.032 | 5.462 ± 0.039 |
3.638 ± 0.027 | 8.557 ± 0.037 |
2.146 ± 0.023 | 4.797 ± 0.029 |
2.79 ± 0.036 | 10.307 ± 0.044 |
Met |
Asn |
Gln |
Pro |
Arg |
Ser |
Thr |
Val |
Trp |
Tyr |
|---|---|---|---|---|---|---|---|---|---|
2.813 ± 0.02 | 2.436 ± 0.021 |
5.207 ± 0.029 | 3.405 ± 0.022 |
7.206 ± 0.035 | 4.981 ± 0.025 |
5.446 ± 0.027 | 7.075 ± 0.034 |
1.448 ± 0.017 | 2.105 ± 0.018 |
Most of the basic statistics you can see at this page can be downloaded from this CSV file
See this proteome in:

Proteome-pI is available under Creative Commons Attribution-NoDerivs license, for more details see here
| Reference: Kozlowski LP. Proteome-pI 2.0: Proteome Isoelectric Point Database Update. Nucleic Acids Res. 2021, doi: 10.1093/nar/gkab944 | Contact: Lukasz P. Kozlowski |