Mycobacterium phage Chuckly
Taxonomy: Viruses; Duplodnaviria; Heunggongvirae; Uroviricota; Caudoviricetes; Caudovirales; Siphoviridae; Cheoctovirus; unclassified Cheoctovirus
Average proteome isoelectric point is 6.05
Get precalculated fractions of proteins
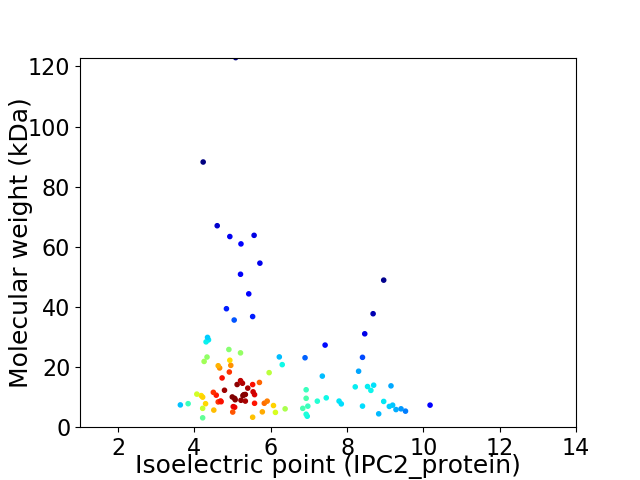
Virtual 2D-PAGE plot for 102 proteins (isoelectric point calculated using IPC2_protein)
Get csv file with sequences according to given criteria:
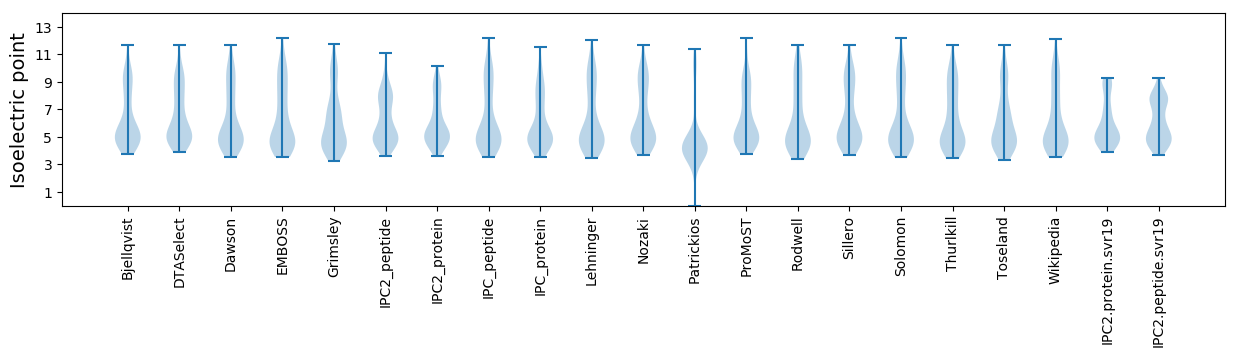
* You can choose from 21 different methods for calculating isoelectric point
Summary statistics related to proteome-wise predictions
Protein with the lowest isoelectric point:
>tr|A0A649VE29|A0A649VE29_9CAUD Serine/threonine kinase OS=Mycobacterium phage Chuckly OX=2656569 GN=99 PE=4 SV=1
MM1 pKa = 8.09DD2 pKa = 5.72EE3 pKa = 4.55IEE5 pKa = 4.2EE6 pKa = 4.21QISRR10 pKa = 11.84IPRR13 pKa = 11.84LIPGEE18 pKa = 4.05RR19 pKa = 11.84CPSCEE24 pKa = 4.17MILLALEE31 pKa = 3.67YY32 pKa = 10.67DD33 pKa = 4.14GLVKK37 pKa = 10.59CLNCLNMWTPDD48 pKa = 3.43EE49 pKa = 4.23LQEE52 pKa = 4.21TLL54 pKa = 4.07
MM1 pKa = 8.09DD2 pKa = 5.72EE3 pKa = 4.55IEE5 pKa = 4.2EE6 pKa = 4.21QISRR10 pKa = 11.84IPRR13 pKa = 11.84LIPGEE18 pKa = 4.05RR19 pKa = 11.84CPSCEE24 pKa = 4.17MILLALEE31 pKa = 3.67YY32 pKa = 10.67DD33 pKa = 4.14GLVKK37 pKa = 10.59CLNCLNMWTPDD48 pKa = 3.43EE49 pKa = 4.23LQEE52 pKa = 4.21TLL54 pKa = 4.07
Molecular weight: 6.27 kDa
Isoelectric point according different methods:
Protein with the highest isoelectric point:
>tr|A0A649VDB7|A0A649VDB7_9CAUD Uncharacterized protein OS=Mycobacterium phage Chuckly OX=2656569 GN=79 PE=4 SV=1
MM1 pKa = 7.13STFPAPRR8 pKa = 11.84TLTEE12 pKa = 5.09RR13 pKa = 11.84IQGAHH18 pKa = 6.7LNLKK22 pKa = 9.83LARR25 pKa = 11.84QAGNPDD31 pKa = 3.49IIAAAEE37 pKa = 4.34RR38 pKa = 11.84ILNQLVDD45 pKa = 4.1RR46 pKa = 11.84LPRR49 pKa = 11.84STSQEE54 pKa = 3.91KK55 pKa = 10.38
MM1 pKa = 7.13STFPAPRR8 pKa = 11.84TLTEE12 pKa = 5.09RR13 pKa = 11.84IQGAHH18 pKa = 6.7LNLKK22 pKa = 9.83LARR25 pKa = 11.84QAGNPDD31 pKa = 3.49IIAAAEE37 pKa = 4.34RR38 pKa = 11.84ILNQLVDD45 pKa = 4.1RR46 pKa = 11.84LPRR49 pKa = 11.84STSQEE54 pKa = 3.91KK55 pKa = 10.38
Molecular weight: 6.11 kDa
Isoelectric point according different methods:
Peptides (in silico digests for buttom-up proteomics)
Below you can find in silico digests of the whole proteome with Trypsin, Chymotrypsin, Trypsin+LysC, LysN, ArgC proteases suitable for different mass spec machines.| Try ESI |
 |
|---|
| ChTry ESI |
|
|---|
| ArgC ESI |
|
|---|
| LysN ESI |
|
|---|
| TryLysC ESI |
|
|---|
| Try MALDI |
|
|---|
| ChTry MALDI |
|
|---|
| ArgC MALDI |
|
|---|
| LysN MALDI |
|
|---|
| TryLysC MALDI |
|
|---|
| Try LTQ |
|
|---|
| ChTry LTQ |
|
|---|
| ArgC LTQ |
|
|---|
| LysN LTQ |
|
|---|
| TryLysC LTQ |
|
|---|
| Try MSlow |
|
|---|
| ChTry MSlow |
|
|---|
| ArgC MSlow |
|
|---|
| LysN MSlow |
|
|---|
| TryLysC MSlow |
|
|---|
| Try MShigh |
|
|---|
| ChTry MShigh |
|
|---|
| ArgC MShigh |
|
|---|
| LysN MShigh |
|
|---|
| TryLysC MShigh |
|
|---|
General Statistics
Number of major isoforms |
Number of additional isoforms |
Number of all proteins |
Number of amino acids |
Min. Seq. Length |
Max. Seq. Length |
Avg. Seq. Length |
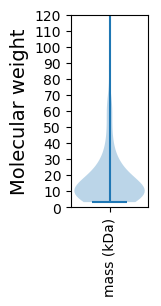
Avg. Mol. Weight |
|---|---|---|---|---|---|---|---|
0 |
17474 |
30 |
1216 |
171.3 |
18.72 |
Amino acid frequency
Ala |
Cys |
Asp |
Glu |
Phe |
Gly |
His |
Ile |
Lys |
Leu |
|---|---|---|---|---|---|---|---|---|---|
10.782 ± 0.455 | 1.236 ± 0.164 |
6.518 ± 0.202 | 6.003 ± 0.3 |
2.901 ± 0.187 | 8.905 ± 0.475 |
2.283 ± 0.201 | 4.326 ± 0.213 |
3.331 ± 0.188 | 7.279 ± 0.205 |
Met |
Asn |
Gln |
Pro |
Arg |
Ser |
Thr |
Val |
Trp |
Tyr |
|---|---|---|---|---|---|---|---|---|---|
2.272 ± 0.126 | 3.359 ± 0.202 |
6.181 ± 0.217 | 3.445 ± 0.184 |
6.822 ± 0.445 | 5.952 ± 0.304 |
6.387 ± 0.242 | 7.182 ± 0.26 |
2.312 ± 0.154 | 2.524 ± 0.185 |
Most of the basic statistics you can see at this page can be downloaded from this CSV file
See this proteome in:

Proteome-pI is available under Creative Commons Attribution-NoDerivs license, for more details see here
| Reference: Kozlowski LP. Proteome-pI 2.0: Proteome Isoelectric Point Database Update. Nucleic Acids Res. 2021, doi: 10.1093/nar/gkab944 | Contact: Lukasz P. Kozlowski |