Vibrio phage NF
Taxonomy: Viruses; Duplodnaviria; Heunggongvirae; Uroviricota; Caudoviricetes; Caudovirales; Siphoviridae; unclassified Siphoviridae
Average proteome isoelectric point is 6.44
Get precalculated fractions of proteins
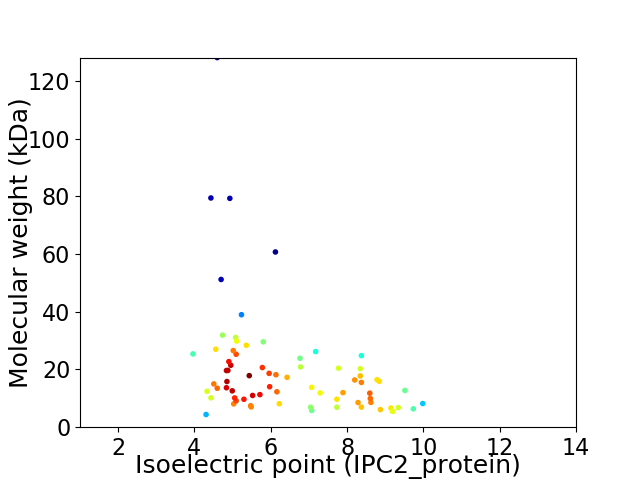
Virtual 2D-PAGE plot for 74 proteins (isoelectric point calculated using IPC2_protein)
Get csv file with sequences according to given criteria:
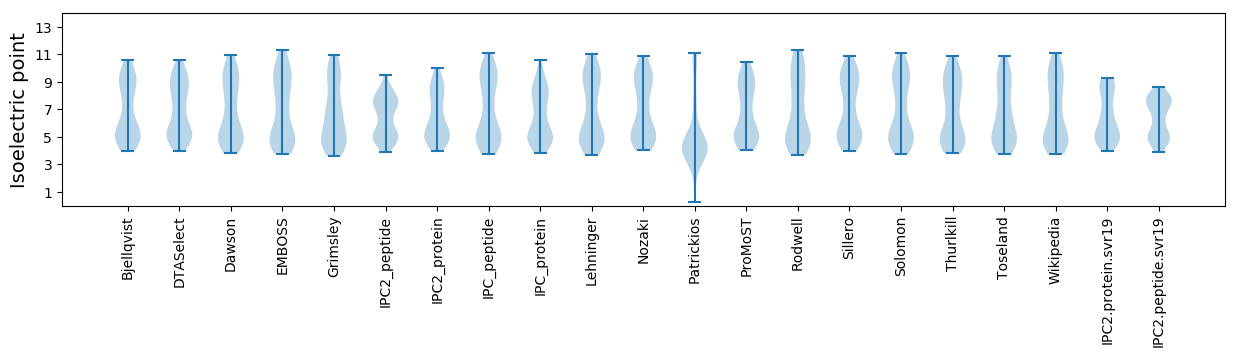
* You can choose from 21 different methods for calculating isoelectric point
Summary statistics related to proteome-wise predictions
Protein with the lowest isoelectric point:
>tr|A0A6B9J178|A0A6B9J178_9CAUD Putative exonuclease OS=Vibrio phage NF OX=2686202 PE=4 SV=1
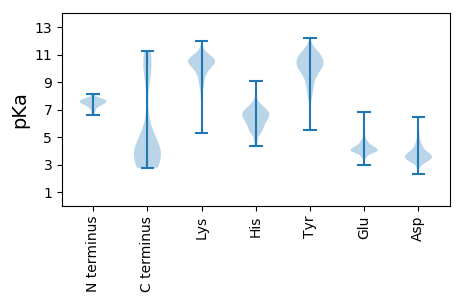
MM1 pKa = 7.74SEE3 pKa = 4.02QLKK6 pKa = 10.55SDD8 pKa = 3.58LSIFIPYY15 pKa = 9.6CLLGISWAYY24 pKa = 10.0GVVSLFEE31 pKa = 3.89WAIEE35 pKa = 3.96LGVII39 pKa = 4.71
MM1 pKa = 7.74SEE3 pKa = 4.02QLKK6 pKa = 10.55SDD8 pKa = 3.58LSIFIPYY15 pKa = 9.6CLLGISWAYY24 pKa = 10.0GVVSLFEE31 pKa = 3.89WAIEE35 pKa = 3.96LGVII39 pKa = 4.71
Molecular weight: 4.39 kDa
Isoelectric point according different methods:
Protein with the highest isoelectric point:
>tr|A0A6B9J049|A0A6B9J049_9CAUD BIG2 domain-containing protein OS=Vibrio phage NF OX=2686202 PE=4 SV=1
MM1 pKa = 7.78SKK3 pKa = 10.27RR4 pKa = 11.84KK5 pKa = 9.43SNKK8 pKa = 8.7RR9 pKa = 11.84VKK11 pKa = 10.78QMICDD16 pKa = 3.81VLVSSSKK23 pKa = 10.26LSKK26 pKa = 10.26VRR28 pKa = 11.84YY29 pKa = 8.53GYY31 pKa = 11.0YY32 pKa = 9.34RR33 pKa = 11.84VKK35 pKa = 10.23FCNVRR40 pKa = 11.84GDD42 pKa = 3.94FVQSINYY49 pKa = 9.15GRR51 pKa = 11.84FHH53 pKa = 7.25FFNSGRR59 pKa = 11.84YY60 pKa = 8.35VSLTASEE67 pKa = 4.21LRR69 pKa = 11.84GG70 pKa = 3.48
MM1 pKa = 7.78SKK3 pKa = 10.27RR4 pKa = 11.84KK5 pKa = 9.43SNKK8 pKa = 8.7RR9 pKa = 11.84VKK11 pKa = 10.78QMICDD16 pKa = 3.81VLVSSSKK23 pKa = 10.26LSKK26 pKa = 10.26VRR28 pKa = 11.84YY29 pKa = 8.53GYY31 pKa = 11.0YY32 pKa = 9.34RR33 pKa = 11.84VKK35 pKa = 10.23FCNVRR40 pKa = 11.84GDD42 pKa = 3.94FVQSINYY49 pKa = 9.15GRR51 pKa = 11.84FHH53 pKa = 7.25FFNSGRR59 pKa = 11.84YY60 pKa = 8.35VSLTASEE67 pKa = 4.21LRR69 pKa = 11.84GG70 pKa = 3.48
Molecular weight: 8.19 kDa
Isoelectric point according different methods:
Peptides (in silico digests for buttom-up proteomics)
Below you can find in silico digests of the whole proteome with Trypsin, Chymotrypsin, Trypsin+LysC, LysN, ArgC proteases suitable for different mass spec machines.| Try ESI |
 |
|---|
| ChTry ESI |
|
|---|
| ArgC ESI |
|
|---|
| LysN ESI |
|
|---|
| TryLysC ESI |
|
|---|
| Try MALDI |
|
|---|
| ChTry MALDI |
|
|---|
| ArgC MALDI |
|
|---|
| LysN MALDI |
|
|---|
| TryLysC MALDI |
|
|---|
| Try LTQ |
|
|---|
| ChTry LTQ |
|
|---|
| ArgC LTQ |
|
|---|
| LysN LTQ |
|
|---|
| TryLysC LTQ |
|
|---|
| Try MSlow |
|
|---|
| ChTry MSlow |
|
|---|
| ArgC MSlow |
|
|---|
| LysN MSlow |
|
|---|
| TryLysC MSlow |
|
|---|
| Try MShigh |
|
|---|
| ChTry MShigh |
|
|---|
| ArgC MShigh |
|
|---|
| LysN MShigh |
|
|---|
| TryLysC MShigh |
|
|---|
General Statistics
Number of major isoforms |
Number of additional isoforms |
Number of all proteins |
Number of amino acids |
Min. Seq. Length |
Max. Seq. Length |
Avg. Seq. Length |
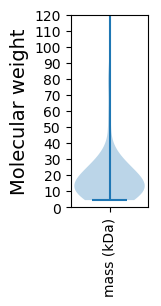
Avg. Mol. Weight |
|---|---|---|---|---|---|---|---|
0 |
13027 |
39 |
1174 |
176.0 |
19.78 |
Amino acid frequency
Ala |
Cys |
Asp |
Glu |
Phe |
Gly |
His |
Ile |
Lys |
Leu |
|---|---|---|---|---|---|---|---|---|---|
7.024 ± 0.511 | 1.428 ± 0.177 |
6.502 ± 0.289 | 7.001 ± 0.35 |
3.815 ± 0.158 | 7.569 ± 0.317 |
1.85 ± 0.187 | 6.586 ± 0.226 |
7.154 ± 0.48 | 7.131 ± 0.221 |
Met |
Asn |
Gln |
Pro |
Arg |
Ser |
Thr |
Val |
Trp |
Tyr |
|---|---|---|---|---|---|---|---|---|---|
2.687 ± 0.22 | 5.205 ± 0.236 |
3.454 ± 0.234 | 4.13 ± 0.255 |
4.629 ± 0.206 | 6.87 ± 0.342 |
5.028 ± 0.347 | 6.563 ± 0.291 |
1.842 ± 0.158 | 3.531 ± 0.156 |
Most of the basic statistics you can see at this page can be downloaded from this CSV file
See this proteome in:

Proteome-pI is available under Creative Commons Attribution-NoDerivs license, for more details see here
| Reference: Kozlowski LP. Proteome-pI 2.0: Proteome Isoelectric Point Database Update. Nucleic Acids Res. 2021, doi: 10.1093/nar/gkab944 | Contact: Lukasz P. Kozlowski |