Streptococcus pneumoniae SP14-BS69
Taxonomy: cellular organisms; Bacteria; Terrabacteria group; Firmicutes; Bacilli; Lactobacillales; Streptococcaceae; Streptococcus; Streptococcus pneumoniae
Average proteome isoelectric point is 6.41
Get precalculated fractions of proteins
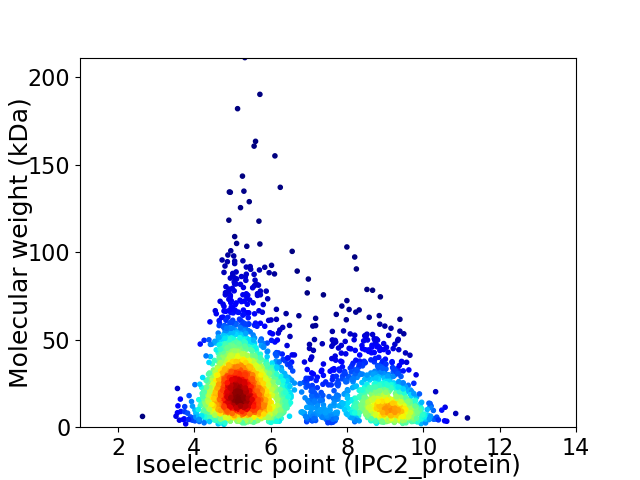
Virtual 2D-PAGE plot for 2767 proteins (isoelectric point calculated using IPC2_protein)
Get csv file with sequences according to given criteria:
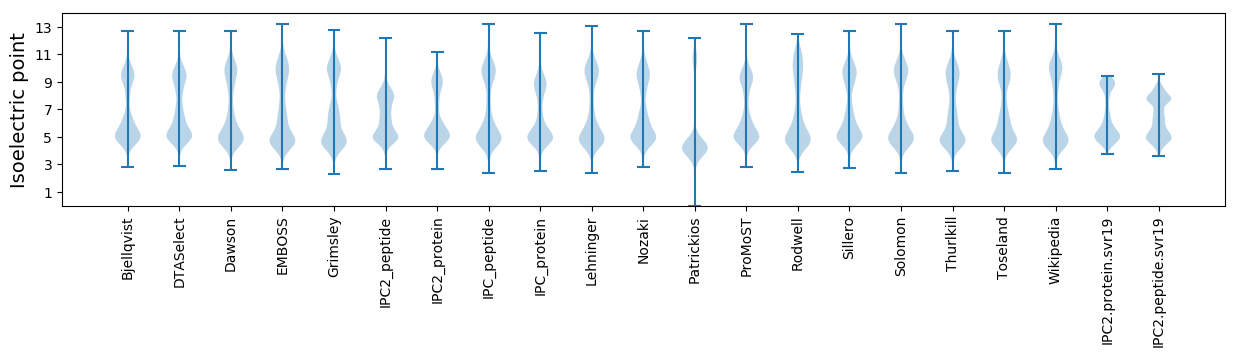
* You can choose from 21 different methods for calculating isoelectric point
Summary statistics related to proteome-wise predictions
Protein with the lowest isoelectric point:
>tr|A5M946|A5M946_STREE Probable GTP-binding protein EngB OS=Streptococcus pneumoniae SP14-BS69 OX=406560 GN=engB PE=3 SV=1
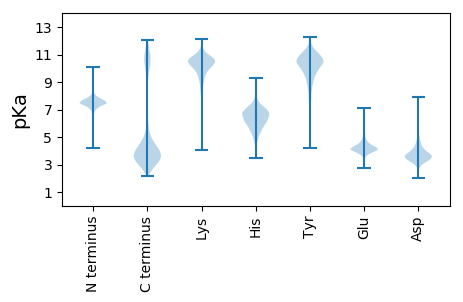
MM1 pKa = 7.87EE2 pKa = 4.51EE3 pKa = 3.56TTYY6 pKa = 11.03DD7 pKa = 3.82IIAKK11 pKa = 9.74SLDD14 pKa = 4.0RR15 pKa = 11.84ISMEE19 pKa = 3.74LHH21 pKa = 5.91QADD24 pKa = 4.33EE25 pKa = 4.59NNDD28 pKa = 3.14FLEE31 pKa = 4.3YY32 pKa = 10.95GFYY35 pKa = 10.31QDD37 pKa = 3.87NN38 pKa = 3.58
MM1 pKa = 7.87EE2 pKa = 4.51EE3 pKa = 3.56TTYY6 pKa = 11.03DD7 pKa = 3.82IIAKK11 pKa = 9.74SLDD14 pKa = 4.0RR15 pKa = 11.84ISMEE19 pKa = 3.74LHH21 pKa = 5.91QADD24 pKa = 4.33EE25 pKa = 4.59NNDD28 pKa = 3.14FLEE31 pKa = 4.3YY32 pKa = 10.95GFYY35 pKa = 10.31QDD37 pKa = 3.87NN38 pKa = 3.58
Molecular weight: 4.56 kDa
Isoelectric point according different methods:
Protein with the highest isoelectric point:
>tr|A5MAD2|A5MAD2_STREE DNA polymerase IV OS=Streptococcus pneumoniae SP14-BS69 OX=406560 GN=dinB PE=3 SV=1
MM1 pKa = 7.35KK2 pKa = 9.43RR3 pKa = 11.84TYY5 pKa = 10.24QPSKK9 pKa = 9.82LRR11 pKa = 11.84RR12 pKa = 11.84ARR14 pKa = 11.84KK15 pKa = 8.57HH16 pKa = 4.75GFRR19 pKa = 11.84NRR21 pKa = 11.84MSTKK25 pKa = 9.22NGRR28 pKa = 11.84RR29 pKa = 11.84VLAARR34 pKa = 11.84RR35 pKa = 11.84RR36 pKa = 11.84KK37 pKa = 8.87GRR39 pKa = 11.84KK40 pKa = 8.75VLAAA44 pKa = 4.31
MM1 pKa = 7.35KK2 pKa = 9.43RR3 pKa = 11.84TYY5 pKa = 10.24QPSKK9 pKa = 9.82LRR11 pKa = 11.84RR12 pKa = 11.84ARR14 pKa = 11.84KK15 pKa = 8.57HH16 pKa = 4.75GFRR19 pKa = 11.84NRR21 pKa = 11.84MSTKK25 pKa = 9.22NGRR28 pKa = 11.84RR29 pKa = 11.84VLAARR34 pKa = 11.84RR35 pKa = 11.84RR36 pKa = 11.84KK37 pKa = 8.87GRR39 pKa = 11.84KK40 pKa = 8.75VLAAA44 pKa = 4.31
Molecular weight: 5.27 kDa
Isoelectric point according different methods:
Peptides (in silico digests for buttom-up proteomics)
Below you can find in silico digests of the whole proteome with Trypsin, Chymotrypsin, Trypsin+LysC, LysN, ArgC proteases suitable for different mass spec machines.| Try ESI |
 |
|---|
| ChTry ESI |
|
|---|
| ArgC ESI |
|
|---|
| LysN ESI |
|
|---|
| TryLysC ESI |
|
|---|
| Try MALDI |
|
|---|
| ChTry MALDI |
|
|---|
| ArgC MALDI |
|
|---|
| LysN MALDI |
|
|---|
| TryLysC MALDI |
|
|---|
| Try LTQ |
|
|---|
| ChTry LTQ |
|
|---|
| ArgC LTQ |
|
|---|
| LysN LTQ |
|
|---|
| TryLysC LTQ |
|
|---|
| Try MSlow |
|
|---|
| ChTry MSlow |
|
|---|
| ArgC MSlow |
|
|---|
| LysN MSlow |
|
|---|
| TryLysC MSlow |
|
|---|
| Try MShigh |
|
|---|
| ChTry MShigh |
|
|---|
| ArgC MShigh |
|
|---|
| LysN MShigh |
|
|---|
| TryLysC MShigh |
|
|---|
General Statistics
Number of major isoforms |
Number of additional isoforms |
Number of all proteins |
Number of amino acids |
Min. Seq. Length |
Max. Seq. Length |
Avg. Seq. Length |
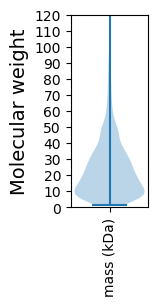
Avg. Mol. Weight |
|---|---|---|---|---|---|---|---|
0 |
614891 |
13 |
1883 |
222.2 |
25.03 |
Amino acid frequency
Ala |
Cys |
Asp |
Glu |
Phe |
Gly |
His |
Ile |
Lys |
Leu |
|---|---|---|---|---|---|---|---|---|---|
7.211 ± 0.056 | 0.643 ± 0.015 |
5.522 ± 0.046 | 7.279 ± 0.051 |
4.651 ± 0.046 | 6.474 ± 0.052 |
1.939 ± 0.022 | 7.233 ± 0.051 |
7.005 ± 0.047 | 10.181 ± 0.073 |
Met |
Asn |
Gln |
Pro |
Arg |
Ser |
Thr |
Val |
Trp |
Tyr |
|---|---|---|---|---|---|---|---|---|---|
2.529 ± 0.021 | 4.425 ± 0.039 |
3.255 ± 0.027 | 4.087 ± 0.042 |
4.151 ± 0.038 | 6.219 ± 0.035 |
5.482 ± 0.038 | 6.926 ± 0.046 |
0.969 ± 0.019 | 3.818 ± 0.033 |
Most of the basic statistics you can see at this page can be downloaded from this CSV file
See this proteome in:

Proteome-pI is available under Creative Commons Attribution-NoDerivs license, for more details see here
| Reference: Kozlowski LP. Proteome-pI 2.0: Proteome Isoelectric Point Database Update. Nucleic Acids Res. 2021, doi: 10.1093/nar/gkab944 | Contact: Lukasz P. Kozlowski |