Staphylococcus phage UPMK_2
Taxonomy: Viruses; Duplodnaviria; Heunggongvirae; Uroviricota; Caudoviricetes; Caudovirales; Siphoviridae; Azeredovirinae; Phietavirus; Staphylococcus virus UPMK2
Average proteome isoelectric point is 6.46
Get precalculated fractions of proteins
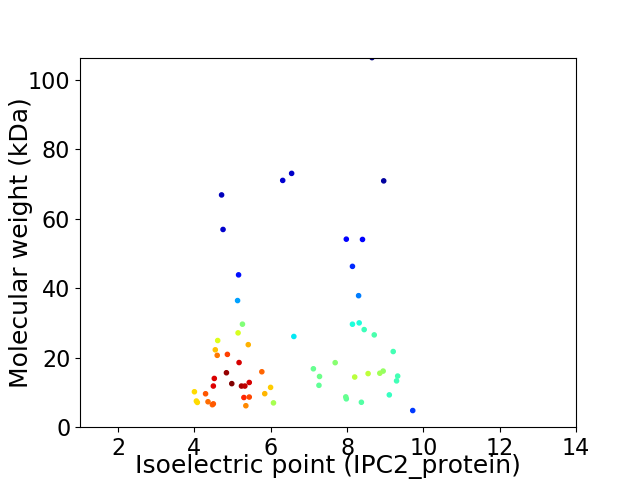
Virtual 2D-PAGE plot for 62 proteins (isoelectric point calculated using IPC2_protein)
Get csv file with sequences according to given criteria:
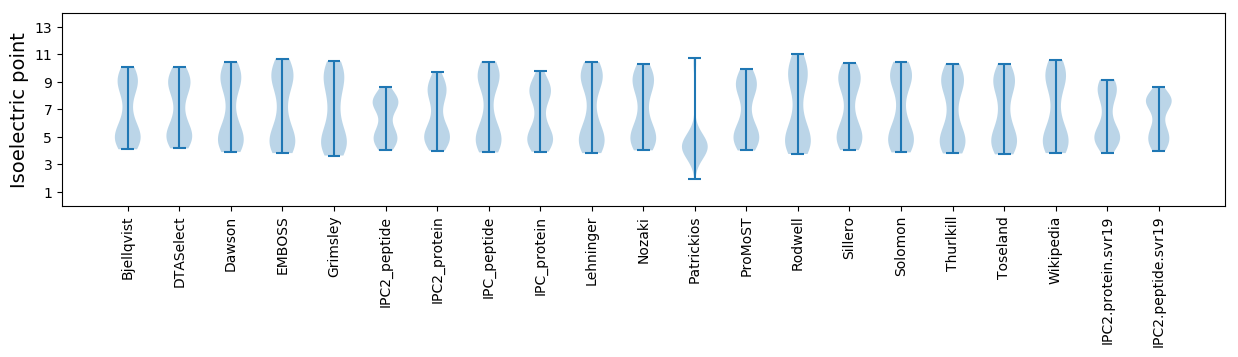
* You can choose from 21 different methods for calculating isoelectric point
Summary statistics related to proteome-wise predictions
Protein with the lowest isoelectric point:
>tr|A0A2I6PCT8|A0A2I6PCT8_9CAUD Uncharacterized protein OS=Staphylococcus phage UPMK_2 OX=2029631 GN=CLI63_00014 PE=4 SV=1
MM1 pKa = 7.28GCLVVVKK8 pKa = 10.07EE9 pKa = 3.89ILRR12 pKa = 11.84LLFLLAMYY20 pKa = 10.11EE21 pKa = 3.89LGNYY25 pKa = 6.9VTEE28 pKa = 4.03QVYY31 pKa = 10.94IMMTANDD38 pKa = 4.14DD39 pKa = 3.74VEE41 pKa = 5.03APSDD45 pKa = 3.89FPKK48 pKa = 11.02LSDD51 pKa = 3.55QYY53 pKa = 11.73DD54 pKa = 3.67LMRR57 pKa = 11.84AEE59 pKa = 4.2VSEE62 pKa = 4.21
MM1 pKa = 7.28GCLVVVKK8 pKa = 10.07EE9 pKa = 3.89ILRR12 pKa = 11.84LLFLLAMYY20 pKa = 10.11EE21 pKa = 3.89LGNYY25 pKa = 6.9VTEE28 pKa = 4.03QVYY31 pKa = 10.94IMMTANDD38 pKa = 4.14DD39 pKa = 3.74VEE41 pKa = 5.03APSDD45 pKa = 3.89FPKK48 pKa = 11.02LSDD51 pKa = 3.55QYY53 pKa = 11.73DD54 pKa = 3.67LMRR57 pKa = 11.84AEE59 pKa = 4.2VSEE62 pKa = 4.21
Molecular weight: 7.12 kDa
Isoelectric point according different methods:
Protein with the highest isoelectric point:
>tr|A0A2I6PCT1|A0A2I6PCT1_9CAUD Uncharacterized protein OS=Staphylococcus phage UPMK_2 OX=2029631 GN=CLI63_00005 PE=4 SV=1
MM1 pKa = 7.32NKK3 pKa = 9.57ILIRR7 pKa = 11.84FAINYY12 pKa = 8.84IKK14 pKa = 10.44YY15 pKa = 8.01QQKK18 pKa = 8.41QLRR21 pKa = 11.84EE22 pKa = 3.59KK23 pKa = 9.95EE24 pKa = 3.86ARR26 pKa = 11.84IKK28 pKa = 10.67YY29 pKa = 10.51LEE31 pKa = 4.46GFLKK35 pKa = 10.83GKK37 pKa = 10.62GYY39 pKa = 11.17
MM1 pKa = 7.32NKK3 pKa = 9.57ILIRR7 pKa = 11.84FAINYY12 pKa = 8.84IKK14 pKa = 10.44YY15 pKa = 8.01QQKK18 pKa = 8.41QLRR21 pKa = 11.84EE22 pKa = 3.59KK23 pKa = 9.95EE24 pKa = 3.86ARR26 pKa = 11.84IKK28 pKa = 10.67YY29 pKa = 10.51LEE31 pKa = 4.46GFLKK35 pKa = 10.83GKK37 pKa = 10.62GYY39 pKa = 11.17
Molecular weight: 4.79 kDa
Isoelectric point according different methods:
Peptides (in silico digests for buttom-up proteomics)
Below you can find in silico digests of the whole proteome with Trypsin, Chymotrypsin, Trypsin+LysC, LysN, ArgC proteases suitable for different mass spec machines.| Try ESI |
 |
|---|
| ChTry ESI |
|
|---|
| ArgC ESI |
|
|---|
| LysN ESI |
|
|---|
| TryLysC ESI |
|
|---|
| Try MALDI |
|
|---|
| ChTry MALDI |
|
|---|
| ArgC MALDI |
|
|---|
| LysN MALDI |
|
|---|
| TryLysC MALDI |
|
|---|
| Try LTQ |
|
|---|
| ChTry LTQ |
|
|---|
| ArgC LTQ |
|
|---|
| LysN LTQ |
|
|---|
| TryLysC LTQ |
|
|---|
| Try MSlow |
|
|---|
| ChTry MSlow |
|
|---|
| ArgC MSlow |
|
|---|
| LysN MSlow |
|
|---|
| TryLysC MSlow |
|
|---|
| Try MShigh |
|
|---|
| ChTry MShigh |
|
|---|
| ArgC MShigh |
|
|---|
| LysN MShigh |
|
|---|
| TryLysC MShigh |
|
|---|
General Statistics
Number of major isoforms |
Number of additional isoforms |
Number of all proteins |
Number of amino acids |
Min. Seq. Length |
Max. Seq. Length |
Avg. Seq. Length |
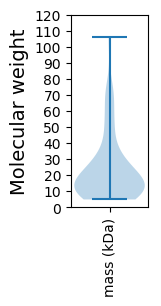
Avg. Mol. Weight |
|---|---|---|---|---|---|---|---|
0 |
12847 |
39 |
989 |
207.2 |
23.71 |
Amino acid frequency
Ala |
Cys |
Asp |
Glu |
Phe |
Gly |
His |
Ile |
Lys |
Leu |
|---|---|---|---|---|---|---|---|---|---|
5.822 ± 0.415 | 0.529 ± 0.093 |
6.546 ± 0.275 | 7.34 ± 0.52 |
4.219 ± 0.204 | 5.877 ± 0.39 |
1.814 ± 0.154 | 7.317 ± 0.245 |
9.107 ± 0.458 | 7.426 ± 0.246 |
Met |
Asn |
Gln |
Pro |
Arg |
Ser |
Thr |
Val |
Trp |
Tyr |
|---|---|---|---|---|---|---|---|---|---|
2.475 ± 0.177 | 6.57 ± 0.254 |
2.794 ± 0.198 | 4.079 ± 0.23 |
4.102 ± 0.267 | 5.768 ± 0.34 |
6.235 ± 0.264 | 6.282 ± 0.284 |
1.253 ± 0.156 | 4.445 ± 0.338 |
Most of the basic statistics you can see at this page can be downloaded from this CSV file
See this proteome in:

Proteome-pI is available under Creative Commons Attribution-NoDerivs license, for more details see here
| Reference: Kozlowski LP. Proteome-pI 2.0: Proteome Isoelectric Point Database Update. Nucleic Acids Res. 2021, doi: 10.1093/nar/gkab944 | Contact: Lukasz P. Kozlowski |