Desulfofustis sp. PB-SRB1
Taxonomy: cellular organisms; Bacteria; Proteobacteria; delta/epsilon subdivisions; Deltaproteobacteria; Desulfobacterales; Desulfobulbaceae; Desulfofustis; unclassified Desulfofustis
Average proteome isoelectric point is 6.35
Get precalculated fractions of proteins
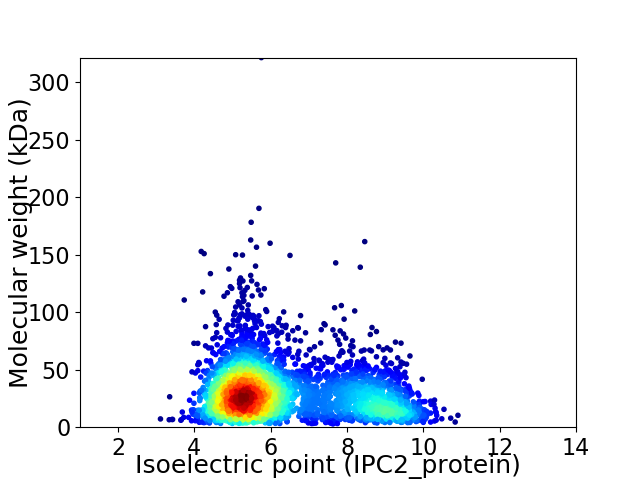
Virtual 2D-PAGE plot for 3578 proteins (isoelectric point calculated using IPC2_protein)
Get csv file with sequences according to given criteria:
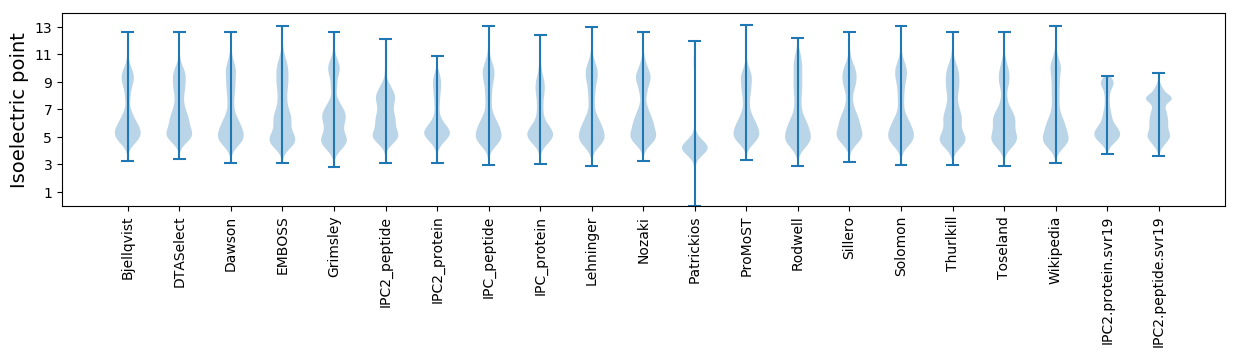
* You can choose from 21 different methods for calculating isoelectric point
Summary statistics related to proteome-wise predictions
Protein with the lowest isoelectric point:
>tr|V4J9P9|V4J9P9_9DELT Methionine aminopeptidase OS=Desulfofustis sp. PB-SRB1 OX=1385624 GN=map PE=3 SV=1
MM1 pKa = 7.81LYY3 pKa = 10.93ADD5 pKa = 4.57IYY7 pKa = 10.9RR8 pKa = 11.84DD9 pKa = 3.42FGTVSFHH16 pKa = 6.72AGVGRR21 pKa = 11.84SVIDD25 pKa = 4.42EE26 pKa = 4.01NVEE29 pKa = 3.79WSFLLSLLLDD39 pKa = 3.51MCFDD43 pKa = 5.56PDD45 pKa = 4.02PSLPPHH51 pKa = 7.3LDD53 pKa = 3.31PGTTDD58 pKa = 3.59LFFGIASFQCTNEE71 pKa = 3.75LSTLIAA77 pKa = 4.57
MM1 pKa = 7.81LYY3 pKa = 10.93ADD5 pKa = 4.57IYY7 pKa = 10.9RR8 pKa = 11.84DD9 pKa = 3.42FGTVSFHH16 pKa = 6.72AGVGRR21 pKa = 11.84SVIDD25 pKa = 4.42EE26 pKa = 4.01NVEE29 pKa = 3.79WSFLLSLLLDD39 pKa = 3.51MCFDD43 pKa = 5.56PDD45 pKa = 4.02PSLPPHH51 pKa = 7.3LDD53 pKa = 3.31PGTTDD58 pKa = 3.59LFFGIASFQCTNEE71 pKa = 3.75LSTLIAA77 pKa = 4.57
Molecular weight: 8.54 kDa
Isoelectric point according different methods:
Protein with the highest isoelectric point:
>tr|V4L3H1|V4L3H1_9DELT Uncharacterized protein OS=Desulfofustis sp. PB-SRB1 OX=1385624 GN=N839_09680 PE=4 SV=1
MM1 pKa = 7.48GGGVNSRR8 pKa = 11.84SISVLLNALGRR19 pKa = 11.84VRR21 pKa = 11.84PLFGKK26 pKa = 8.52STVANGLVVMWRR38 pKa = 11.84LLVRR42 pKa = 4.26
MM1 pKa = 7.48GGGVNSRR8 pKa = 11.84SISVLLNALGRR19 pKa = 11.84VRR21 pKa = 11.84PLFGKK26 pKa = 8.52STVANGLVVMWRR38 pKa = 11.84LLVRR42 pKa = 4.26
Molecular weight: 4.5 kDa
Isoelectric point according different methods:
Peptides (in silico digests for buttom-up proteomics)
Below you can find in silico digests of the whole proteome with Trypsin, Chymotrypsin, Trypsin+LysC, LysN, ArgC proteases suitable for different mass spec machines.| Try ESI |
 |
|---|
| ChTry ESI |
|
|---|
| ArgC ESI |
|
|---|
| LysN ESI |
|
|---|
| TryLysC ESI |
|
|---|
| Try MALDI |
|
|---|
| ChTry MALDI |
|
|---|
| ArgC MALDI |
|
|---|
| LysN MALDI |
|
|---|
| TryLysC MALDI |
|
|---|
| Try LTQ |
|
|---|
| ChTry LTQ |
|
|---|
| ArgC LTQ |
|
|---|
| LysN LTQ |
|
|---|
| TryLysC LTQ |
|
|---|
| Try MSlow |
|
|---|
| ChTry MSlow |
|
|---|
| ArgC MSlow |
|
|---|
| LysN MSlow |
|
|---|
| TryLysC MSlow |
|
|---|
| Try MShigh |
|
|---|
| ChTry MShigh |
|
|---|
| ArgC MShigh |
|
|---|
| LysN MShigh |
|
|---|
| TryLysC MShigh |
|
|---|
General Statistics
Number of major isoforms |
Number of additional isoforms |
Number of all proteins |
Number of amino acids |
Min. Seq. Length |
Max. Seq. Length |
Avg. Seq. Length |
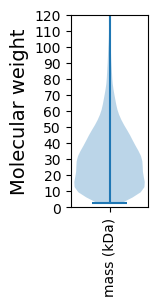
Avg. Mol. Weight |
|---|---|---|---|---|---|---|---|
0 |
1046809 |
29 |
2855 |
292.6 |
32.36 |
Amino acid frequency
Ala |
Cys |
Asp |
Glu |
Phe |
Gly |
His |
Ile |
Lys |
Leu |
|---|---|---|---|---|---|---|---|---|---|
9.394 ± 0.043 | 1.266 ± 0.017 |
5.464 ± 0.035 | 6.159 ± 0.041 |
4.249 ± 0.032 | 7.758 ± 0.036 |
2.363 ± 0.021 | 6.635 ± 0.037 |
4.023 ± 0.036 | 10.35 ± 0.053 |
Met |
Asn |
Gln |
Pro |
Arg |
Ser |
Thr |
Val |
Trp |
Tyr |
|---|---|---|---|---|---|---|---|---|---|
2.599 ± 0.021 | 3.112 ± 0.021 |
4.537 ± 0.027 | 3.466 ± 0.026 |
6.163 ± 0.033 | 5.76 ± 0.028 |
5.466 ± 0.024 | 7.121 ± 0.035 |
1.179 ± 0.017 | 2.935 ± 0.023 |
Most of the basic statistics you can see at this page can be downloaded from this CSV file
See this proteome in:

Proteome-pI is available under Creative Commons Attribution-NoDerivs license, for more details see here
| Reference: Kozlowski LP. Proteome-pI 2.0: Proteome Isoelectric Point Database Update. Nucleic Acids Res. 2021, doi: 10.1093/nar/gkab944 | Contact: Lukasz P. Kozlowski |