Delftia phage IME-DE1
Taxonomy: Viruses; Duplodnaviria; Heunggongvirae; Uroviricota; Caudoviricetes; Caudovirales; Autographiviridae; Piedvirus; Delftia virus IMEDE1
Average proteome isoelectric point is 6.8
Get precalculated fractions of proteins
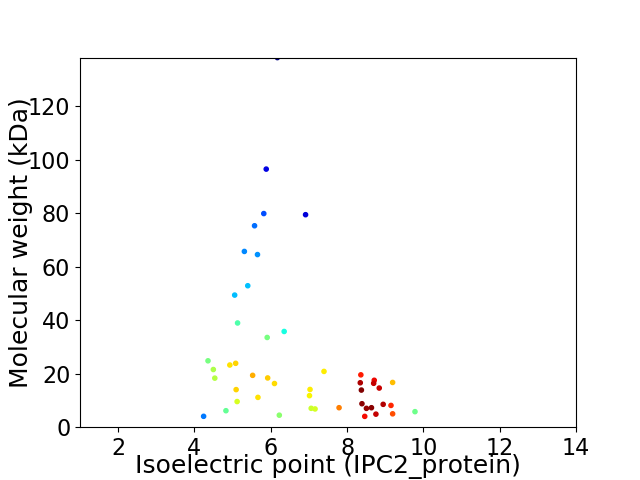
Virtual 2D-PAGE plot for 48 proteins (isoelectric point calculated using IPC2_protein)
Get csv file with sequences according to given criteria:
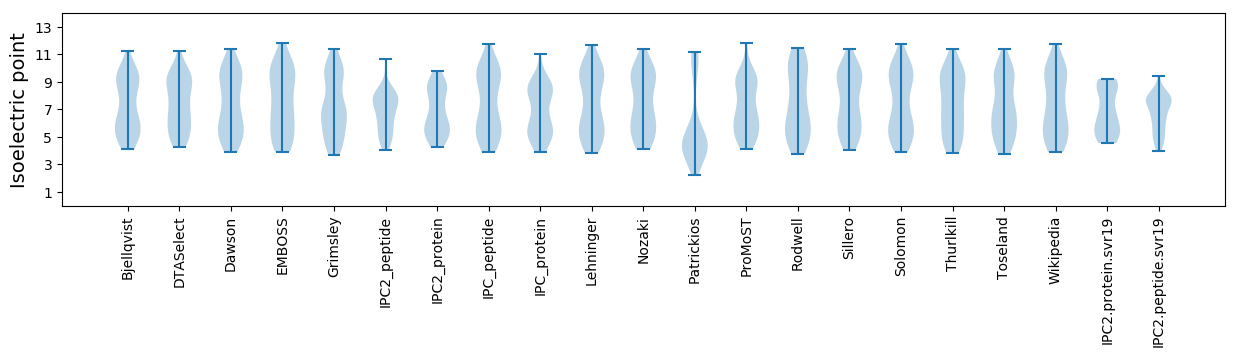
* You can choose from 21 different methods for calculating isoelectric point
Summary statistics related to proteome-wise predictions
Protein with the lowest isoelectric point:
>tr|A0A0F7ILQ6|A0A0F7ILQ6_9CAUD Uncharacterized protein OS=Delftia phage IME-DE1 OX=1647385 PE=4 SV=1
MM1 pKa = 7.64AEE3 pKa = 3.82VSQALMFSAMFLLWMSIPKK22 pKa = 10.31DD23 pKa = 3.66DD24 pKa = 5.49DD25 pKa = 3.72EE26 pKa = 5.8PPTGSAPVVPRR37 pKa = 4.04
MM1 pKa = 7.64AEE3 pKa = 3.82VSQALMFSAMFLLWMSIPKK22 pKa = 10.31DD23 pKa = 3.66DD24 pKa = 5.49DD25 pKa = 3.72EE26 pKa = 5.8PPTGSAPVVPRR37 pKa = 4.04
Molecular weight: 4.07 kDa
Isoelectric point according different methods:
Protein with the highest isoelectric point:
>tr|A0A0F7IK60|A0A0F7IK60_9CAUD Uncharacterized protein OS=Delftia phage IME-DE1 OX=1647385 PE=4 SV=1
MM1 pKa = 7.07SQSNEE6 pKa = 3.8NFQKK10 pKa = 9.37TRR12 pKa = 11.84KK13 pKa = 7.0TRR15 pKa = 11.84EE16 pKa = 3.91SQGFADD22 pKa = 4.65LQAHH26 pKa = 7.93RR27 pKa = 11.84IRR29 pKa = 11.84KK30 pKa = 8.07QKK32 pKa = 10.04RR33 pKa = 11.84QQAHH37 pKa = 4.57KK38 pKa = 9.66QARR41 pKa = 11.84RR42 pKa = 11.84DD43 pKa = 3.72ALEE46 pKa = 4.0DD47 pKa = 3.31RR48 pKa = 4.9
MM1 pKa = 7.07SQSNEE6 pKa = 3.8NFQKK10 pKa = 9.37TRR12 pKa = 11.84KK13 pKa = 7.0TRR15 pKa = 11.84EE16 pKa = 3.91SQGFADD22 pKa = 4.65LQAHH26 pKa = 7.93RR27 pKa = 11.84IRR29 pKa = 11.84KK30 pKa = 8.07QKK32 pKa = 10.04RR33 pKa = 11.84QQAHH37 pKa = 4.57KK38 pKa = 9.66QARR41 pKa = 11.84RR42 pKa = 11.84DD43 pKa = 3.72ALEE46 pKa = 4.0DD47 pKa = 3.31RR48 pKa = 4.9
Molecular weight: 5.81 kDa
Isoelectric point according different methods:
Peptides (in silico digests for buttom-up proteomics)
Below you can find in silico digests of the whole proteome with Trypsin, Chymotrypsin, Trypsin+LysC, LysN, ArgC proteases suitable for different mass spec machines.| Try ESI |
 |
|---|
| ChTry ESI |
|
|---|
| ArgC ESI |
|
|---|
| LysN ESI |
|
|---|
| TryLysC ESI |
|
|---|
| Try MALDI |
|
|---|
| ChTry MALDI |
|
|---|
| ArgC MALDI |
|
|---|
| LysN MALDI |
|
|---|
| TryLysC MALDI |
|
|---|
| Try LTQ |
|
|---|
| ChTry LTQ |
|
|---|
| ArgC LTQ |
|
|---|
| LysN LTQ |
|
|---|
| TryLysC LTQ |
|
|---|
| Try MSlow |
|
|---|
| ChTry MSlow |
|
|---|
| ArgC MSlow |
|
|---|
| LysN MSlow |
|
|---|
| TryLysC MSlow |
|
|---|
| Try MShigh |
|
|---|
| ChTry MShigh |
|
|---|
| ArgC MShigh |
|
|---|
| LysN MShigh |
|
|---|
| TryLysC MShigh |
|
|---|
General Statistics
Number of major isoforms |
Number of additional isoforms |
Number of all proteins |
Number of amino acids |
Min. Seq. Length |
Max. Seq. Length |
Avg. Seq. Length |
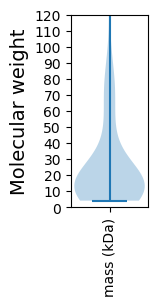
Avg. Mol. Weight |
|---|---|---|---|---|---|---|---|
0 |
11528 |
37 |
1290 |
240.2 |
26.42 |
Amino acid frequency
Ala |
Cys |
Asp |
Glu |
Phe |
Gly |
His |
Ile |
Lys |
Leu |
|---|---|---|---|---|---|---|---|---|---|
11.234 ± 0.693 | 0.954 ± 0.155 |
5.812 ± 0.26 | 6.358 ± 0.365 |
3.591 ± 0.268 | 8.276 ± 0.366 |
1.917 ± 0.217 | 4.615 ± 0.201 |
6.098 ± 0.437 | 7.981 ± 0.317 |
Met |
Asn |
Gln |
Pro |
Arg |
Ser |
Thr |
Val |
Trp |
Tyr |
|---|---|---|---|---|---|---|---|---|---|
2.403 ± 0.204 | 3.86 ± 0.267 |
4.511 ± 0.23 | 4.502 ± 0.39 |
5.43 ± 0.183 | 5.647 ± 0.312 |
5.283 ± 0.295 | 6.757 ± 0.238 |
1.848 ± 0.205 | 2.923 ± 0.149 |
Most of the basic statistics you can see at this page can be downloaded from this CSV file
See this proteome in:

Proteome-pI is available under Creative Commons Attribution-NoDerivs license, for more details see here
| Reference: Kozlowski LP. Proteome-pI 2.0: Proteome Isoelectric Point Database Update. Nucleic Acids Res. 2021, doi: 10.1093/nar/gkab944 | Contact: Lukasz P. Kozlowski |