Geobacillus phage GBK2
Taxonomy: Viruses; Duplodnaviria; Heunggongvirae; Uroviricota; Caudoviricetes; Caudovirales; Siphoviridae; unclassified Siphoviridae
Average proteome isoelectric point is 6.8
Get precalculated fractions of proteins
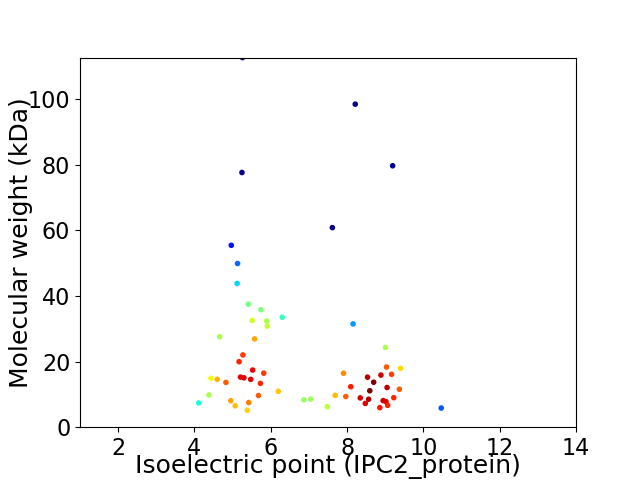
Virtual 2D-PAGE plot for 62 proteins (isoelectric point calculated using IPC2_protein)
Get csv file with sequences according to given criteria:
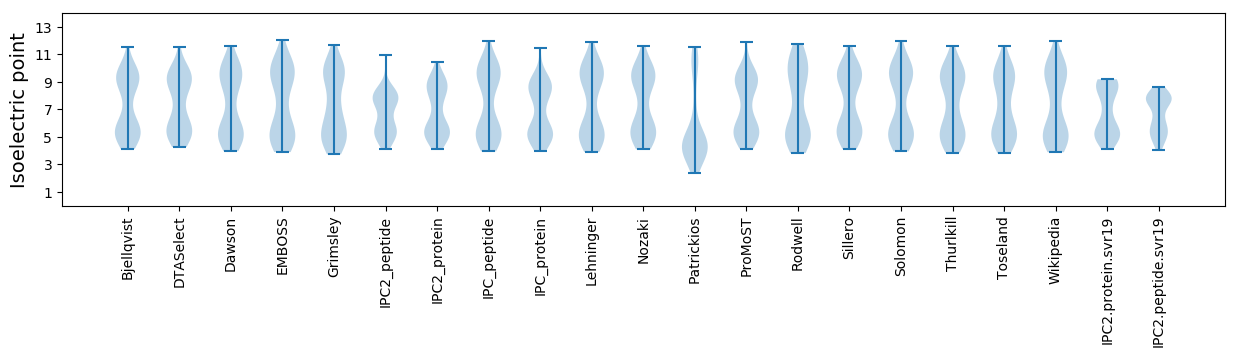
* You can choose from 21 different methods for calculating isoelectric point
Summary statistics related to proteome-wise predictions
Protein with the lowest isoelectric point:
>tr|W8ECW0|W8ECW0_9CAUD Holin OS=Geobacillus phage GBK2 OX=1458842 GN=GBK2_23 PE=4 SV=1
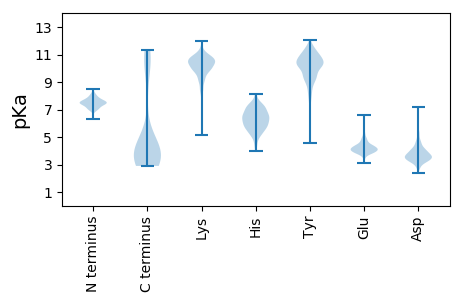
MM1 pKa = 7.65INFEE5 pKa = 5.29LFTQLIEE12 pKa = 3.86VDD14 pKa = 3.34MSKK17 pKa = 10.56KK18 pKa = 9.95VDD20 pKa = 4.13EE21 pKa = 4.83IEE23 pKa = 4.71IDD25 pKa = 3.66LQIYY29 pKa = 10.17DD30 pKa = 3.83CTGEE34 pKa = 4.19VNITDD39 pKa = 3.4IMLQGGSIATVWTGHH54 pKa = 6.03PSEE57 pKa = 5.22LRR59 pKa = 11.84WSHH62 pKa = 7.35DD63 pKa = 3.51YY64 pKa = 11.33
MM1 pKa = 7.65INFEE5 pKa = 5.29LFTQLIEE12 pKa = 3.86VDD14 pKa = 3.34MSKK17 pKa = 10.56KK18 pKa = 9.95VDD20 pKa = 4.13EE21 pKa = 4.83IEE23 pKa = 4.71IDD25 pKa = 3.66LQIYY29 pKa = 10.17DD30 pKa = 3.83CTGEE34 pKa = 4.19VNITDD39 pKa = 3.4IMLQGGSIATVWTGHH54 pKa = 6.03PSEE57 pKa = 5.22LRR59 pKa = 11.84WSHH62 pKa = 7.35DD63 pKa = 3.51YY64 pKa = 11.33
Molecular weight: 7.39 kDa
Isoelectric point according different methods:
Protein with the highest isoelectric point:
>tr|W8ECX3|W8ECX3_9CAUD Recombinase OS=Geobacillus phage GBK2 OX=1458842 GN=GBK2_38 PE=4 SV=1
MM1 pKa = 7.45LNARR5 pKa = 11.84AKK7 pKa = 9.52INKK10 pKa = 8.46RR11 pKa = 11.84RR12 pKa = 11.84AGLRR16 pKa = 11.84ILLLMRR22 pKa = 11.84VFGKK26 pKa = 10.26IFSVFSAIFFDD37 pKa = 3.74LGVYY41 pKa = 9.31KK42 pKa = 10.73VNKK45 pKa = 9.37IVYY48 pKa = 9.22NKK50 pKa = 10.57
MM1 pKa = 7.45LNARR5 pKa = 11.84AKK7 pKa = 9.52INKK10 pKa = 8.46RR11 pKa = 11.84RR12 pKa = 11.84AGLRR16 pKa = 11.84ILLLMRR22 pKa = 11.84VFGKK26 pKa = 10.26IFSVFSAIFFDD37 pKa = 3.74LGVYY41 pKa = 9.31KK42 pKa = 10.73VNKK45 pKa = 9.37IVYY48 pKa = 9.22NKK50 pKa = 10.57
Molecular weight: 5.83 kDa
Isoelectric point according different methods:
Peptides (in silico digests for buttom-up proteomics)
Below you can find in silico digests of the whole proteome with Trypsin, Chymotrypsin, Trypsin+LysC, LysN, ArgC proteases suitable for different mass spec machines.| Try ESI |
 |
|---|
| ChTry ESI |
|
|---|
| ArgC ESI |
|
|---|
| LysN ESI |
|
|---|
| TryLysC ESI |
|
|---|
| Try MALDI |
|
|---|
| ChTry MALDI |
|
|---|
| ArgC MALDI |
|
|---|
| LysN MALDI |
|
|---|
| TryLysC MALDI |
|
|---|
| Try LTQ |
|
|---|
| ChTry LTQ |
|
|---|
| ArgC LTQ |
|
|---|
| LysN LTQ |
|
|---|
| TryLysC LTQ |
|
|---|
| Try MSlow |
|
|---|
| ChTry MSlow |
|
|---|
| ArgC MSlow |
|
|---|
| LysN MSlow |
|
|---|
| TryLysC MSlow |
|
|---|
| Try MShigh |
|
|---|
| ChTry MShigh |
|
|---|
| ArgC MShigh |
|
|---|
| LysN MShigh |
|
|---|
| TryLysC MShigh |
|
|---|
General Statistics
Number of major isoforms |
Number of additional isoforms |
Number of all proteins |
Number of amino acids |
Min. Seq. Length |
Max. Seq. Length |
Avg. Seq. Length |
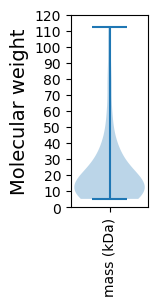
Avg. Mol. Weight |
|---|---|---|---|---|---|---|---|
0 |
12314 |
44 |
988 |
198.6 |
22.64 |
Amino acid frequency
Ala |
Cys |
Asp |
Glu |
Phe |
Gly |
His |
Ile |
Lys |
Leu |
|---|---|---|---|---|---|---|---|---|---|
7.634 ± 0.447 | 0.958 ± 0.161 |
5.392 ± 0.311 | 7.902 ± 0.45 |
4.036 ± 0.238 | 6.797 ± 0.258 |
1.559 ± 0.151 | 7.171 ± 0.271 |
8.226 ± 0.488 | 7.78 ± 0.256 |
Met |
Asn |
Gln |
Pro |
Arg |
Ser |
Thr |
Val |
Trp |
Tyr |
|---|---|---|---|---|---|---|---|---|---|
3.102 ± 0.246 | 5.66 ± 0.241 |
3.987 ± 0.215 | 3.898 ± 0.218 |
5.051 ± 0.257 | 3.874 ± 0.232 |
5.222 ± 0.355 | 5.944 ± 0.217 |
1.6 ± 0.111 | 4.207 ± 0.336 |
Most of the basic statistics you can see at this page can be downloaded from this CSV file
See this proteome in:

Proteome-pI is available under Creative Commons Attribution-NoDerivs license, for more details see here
| Reference: Kozlowski LP. Proteome-pI 2.0: Proteome Isoelectric Point Database Update. Nucleic Acids Res. 2021, doi: 10.1093/nar/gkab944 | Contact: Lukasz P. Kozlowski |