Sphingomonas sp. WZY 27
Taxonomy: cellular organisms; Bacteria; Proteobacteria; Alphaproteobacteria; Sphingomonadales; Sphingomonadaceae; Sphingomonas; unclassified Sphingomonas
Average proteome isoelectric point is 6.78
Get precalculated fractions of proteins
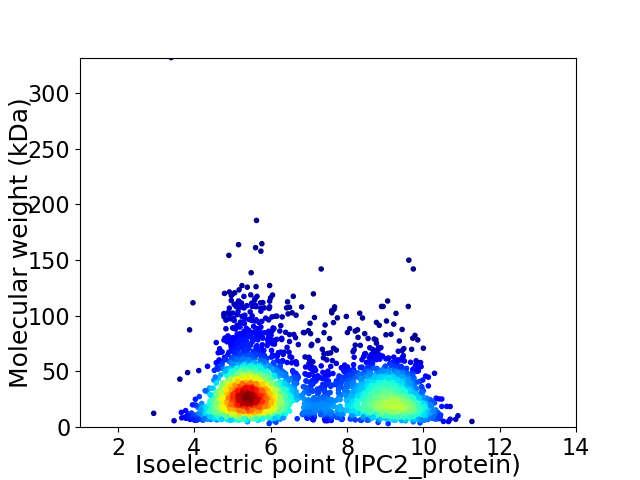
Virtual 2D-PAGE plot for 3410 proteins (isoelectric point calculated using IPC2_protein)
Get csv file with sequences according to given criteria:
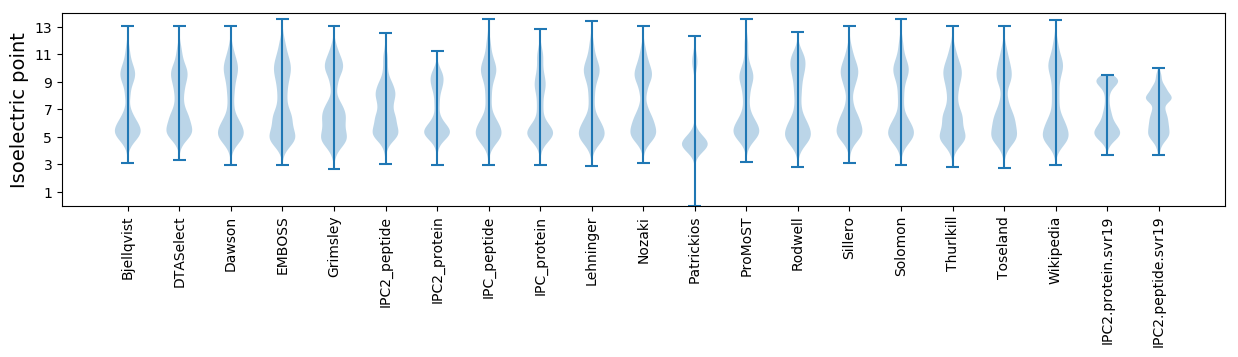
* You can choose from 21 different methods for calculating isoelectric point
Summary statistics related to proteome-wise predictions
Protein with the lowest isoelectric point:
>tr|A0A369VZ37|A0A369VZ37_9SPHN Permease OS=Sphingomonas sp. WZY 27 OX=2283317 GN=DVW87_05275 PE=4 SV=1
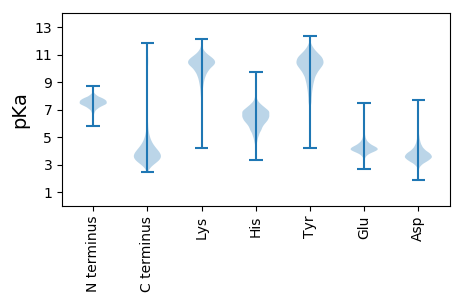
MM1 pKa = 7.82ALPNYY6 pKa = 10.43DD7 pKa = 3.53FLQYY11 pKa = 11.04ILTTSDD17 pKa = 2.85IVIQDD22 pKa = 3.43FVRR25 pKa = 11.84RR26 pKa = 11.84LCMAAISDD34 pKa = 3.76DD35 pKa = 3.73DD36 pKa = 4.12AAVFGWSTVLQLVKK50 pKa = 10.84AGWVPAADD58 pKa = 4.32LPSNDD63 pKa = 3.41IACVIANLCLAPTQTDD79 pKa = 3.57DD80 pKa = 5.69ADD82 pKa = 3.75MANCPDD88 pKa = 3.93RR89 pKa = 11.84GDD91 pKa = 3.59GRR93 pKa = 11.84LIPHH97 pKa = 7.4
MM1 pKa = 7.82ALPNYY6 pKa = 10.43DD7 pKa = 3.53FLQYY11 pKa = 11.04ILTTSDD17 pKa = 2.85IVIQDD22 pKa = 3.43FVRR25 pKa = 11.84RR26 pKa = 11.84LCMAAISDD34 pKa = 3.76DD35 pKa = 3.73DD36 pKa = 4.12AAVFGWSTVLQLVKK50 pKa = 10.84AGWVPAADD58 pKa = 4.32LPSNDD63 pKa = 3.41IACVIANLCLAPTQTDD79 pKa = 3.57DD80 pKa = 5.69ADD82 pKa = 3.75MANCPDD88 pKa = 3.93RR89 pKa = 11.84GDD91 pKa = 3.59GRR93 pKa = 11.84LIPHH97 pKa = 7.4
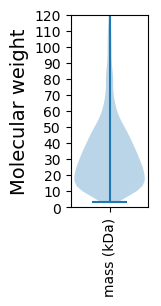
Molecular weight: 10.53 kDa
Isoelectric point according different methods:
Protein with the highest isoelectric point:
>tr|A0A369W4Z8|A0A369W4Z8_9SPHN Spore coat U domain-containing protein OS=Sphingomonas sp. WZY 27 OX=2283317 GN=DVW87_05655 PE=4 SV=1
MM1 pKa = 7.45KK2 pKa = 9.61RR3 pKa = 11.84TFQPSNLVRR12 pKa = 11.84ARR14 pKa = 11.84RR15 pKa = 11.84HH16 pKa = 4.58GFRR19 pKa = 11.84SRR21 pKa = 11.84MATVGGRR28 pKa = 11.84NVIRR32 pKa = 11.84ARR34 pKa = 11.84RR35 pKa = 11.84NRR37 pKa = 11.84GRR39 pKa = 11.84KK40 pKa = 9.0KK41 pKa = 10.58LSAA44 pKa = 4.03
MM1 pKa = 7.45KK2 pKa = 9.61RR3 pKa = 11.84TFQPSNLVRR12 pKa = 11.84ARR14 pKa = 11.84RR15 pKa = 11.84HH16 pKa = 4.58GFRR19 pKa = 11.84SRR21 pKa = 11.84MATVGGRR28 pKa = 11.84NVIRR32 pKa = 11.84ARR34 pKa = 11.84RR35 pKa = 11.84NRR37 pKa = 11.84GRR39 pKa = 11.84KK40 pKa = 9.0KK41 pKa = 10.58LSAA44 pKa = 4.03
Molecular weight: 5.15 kDa
Isoelectric point according different methods:
Peptides (in silico digests for buttom-up proteomics)
Below you can find in silico digests of the whole proteome with Trypsin, Chymotrypsin, Trypsin+LysC, LysN, ArgC proteases suitable for different mass spec machines.| Try ESI |
 |
|---|
| ChTry ESI |
|
|---|
| ArgC ESI |
|
|---|
| LysN ESI |
|
|---|
| TryLysC ESI |
|
|---|
| Try MALDI |
|
|---|
| ChTry MALDI |
|
|---|
| ArgC MALDI |
|
|---|
| LysN MALDI |
|
|---|
| TryLysC MALDI |
|
|---|
| Try LTQ |
|
|---|
| ChTry LTQ |
|
|---|
| ArgC LTQ |
|
|---|
| LysN LTQ |
|
|---|
| TryLysC LTQ |
|
|---|
| Try MSlow |
|
|---|
| ChTry MSlow |
|
|---|
| ArgC MSlow |
|
|---|
| LysN MSlow |
|
|---|
| TryLysC MSlow |
|
|---|
| Try MShigh |
|
|---|
| ChTry MShigh |
|
|---|
| ArgC MShigh |
|
|---|
| LysN MShigh |
|
|---|
| TryLysC MShigh |
|
|---|
General Statistics
Number of major isoforms |
Number of additional isoforms |
Number of all proteins |
Number of amino acids |
Min. Seq. Length |
Max. Seq. Length |
Avg. Seq. Length |
Avg. Mol. Weight |
|---|---|---|---|---|---|---|---|
0 |
1085316 |
28 |
3492 |
318.3 |
34.23 |
Amino acid frequency
Ala |
Cys |
Asp |
Glu |
Phe |
Gly |
His |
Ile |
Lys |
Leu |
|---|---|---|---|---|---|---|---|---|---|
14.228 ± 0.058 | 0.733 ± 0.011 |
5.745 ± 0.03 | 5.341 ± 0.039 |
3.411 ± 0.026 | 9.067 ± 0.042 |
1.915 ± 0.022 | 4.338 ± 0.027 |
2.567 ± 0.035 | 10.129 ± 0.056 |
Met |
Asn |
Gln |
Pro |
Arg |
Ser |
Thr |
Val |
Trp |
Tyr |
|---|---|---|---|---|---|---|---|---|---|
2.156 ± 0.022 | 2.386 ± 0.029 |
5.534 ± 0.037 | 3.146 ± 0.023 |
7.929 ± 0.051 | 4.945 ± 0.034 |
5.435 ± 0.039 | 7.455 ± 0.034 |
1.446 ± 0.018 | 2.094 ± 0.02 |
Most of the basic statistics you can see at this page can be downloaded from this CSV file
See this proteome in:

Proteome-pI is available under Creative Commons Attribution-NoDerivs license, for more details see here
| Reference: Kozlowski LP. Proteome-pI 2.0: Proteome Isoelectric Point Database Update. Nucleic Acids Res. 2021, doi: 10.1093/nar/gkab944 | Contact: Lukasz P. Kozlowski |