Staphylococcus virus 52a
Taxonomy: Viruses; Duplodnaviria; Heunggongvirae; Uroviricota; Caudoviricetes; Caudovirales; Siphoviridae; Azeredovirinae; Phietavirus
Average proteome isoelectric point is 6.67
Get precalculated fractions of proteins
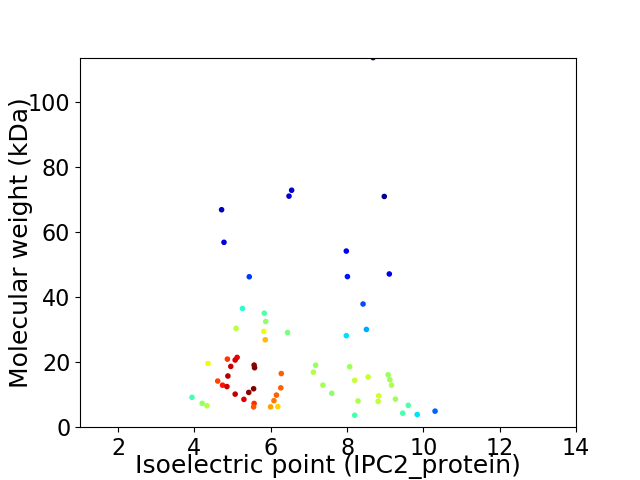
Virtual 2D-PAGE plot for 65 proteins (isoelectric point calculated using IPC2_protein)
Get csv file with sequences according to given criteria:
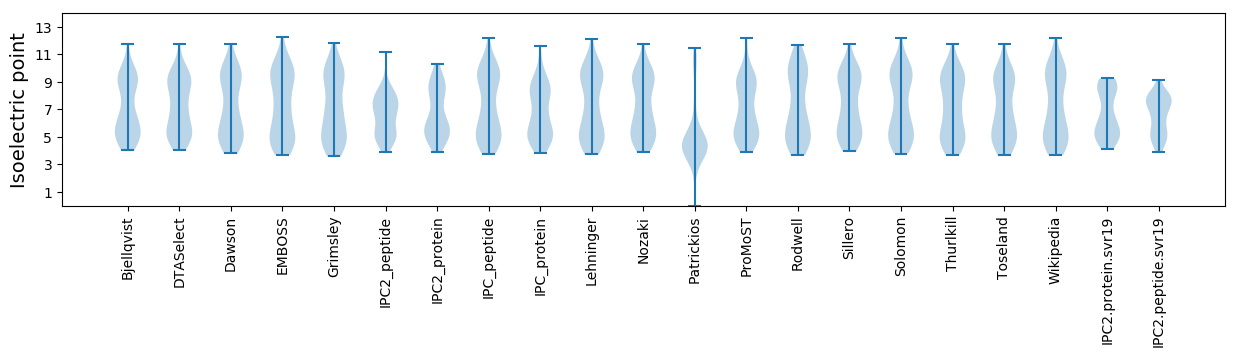
* You can choose from 21 different methods for calculating isoelectric point
Summary statistics related to proteome-wise predictions
Protein with the lowest isoelectric point:
>tr|Q4ZAR7|Q4ZAR7_9CAUD ORF033 OS=Staphylococcus virus 52a OX=320847 PE=4 SV=1
MM1 pKa = 6.89QQQAYY6 pKa = 9.38INATIDD12 pKa = 2.95IRR14 pKa = 11.84IPTEE18 pKa = 3.74VEE20 pKa = 3.68YY21 pKa = 10.96HH22 pKa = 6.61HH23 pKa = 7.08FDD25 pKa = 4.33DD26 pKa = 3.91VDD28 pKa = 3.54KK29 pKa = 10.81EE30 pKa = 4.39KK31 pKa = 11.06EE32 pKa = 4.04VLADD36 pKa = 3.49YY37 pKa = 10.72LYY39 pKa = 11.16NNPDD43 pKa = 3.71EE44 pKa = 4.28ILEE47 pKa = 3.92YY48 pKa = 11.25DD49 pKa = 3.43NLKK52 pKa = 9.69IRR54 pKa = 11.84NVNVEE59 pKa = 3.93VEE61 pKa = 4.1
MM1 pKa = 6.89QQQAYY6 pKa = 9.38INATIDD12 pKa = 2.95IRR14 pKa = 11.84IPTEE18 pKa = 3.74VEE20 pKa = 3.68YY21 pKa = 10.96HH22 pKa = 6.61HH23 pKa = 7.08FDD25 pKa = 4.33DD26 pKa = 3.91VDD28 pKa = 3.54KK29 pKa = 10.81EE30 pKa = 4.39KK31 pKa = 11.06EE32 pKa = 4.04VLADD36 pKa = 3.49YY37 pKa = 10.72LYY39 pKa = 11.16NNPDD43 pKa = 3.71EE44 pKa = 4.28ILEE47 pKa = 3.92YY48 pKa = 11.25DD49 pKa = 3.43NLKK52 pKa = 9.69IRR54 pKa = 11.84NVNVEE59 pKa = 3.93VEE61 pKa = 4.1
Molecular weight: 7.33 kDa
Isoelectric point according different methods:
Protein with the highest isoelectric point:
>tr|Q4ZAT0|Q4ZAT0_9CAUD ORF079 OS=Staphylococcus virus 52a OX=320847 PE=4 SV=1
MM1 pKa = 7.2NVAILANPAIDD12 pKa = 3.52HH13 pKa = 6.54AVVKK17 pKa = 9.88YY18 pKa = 10.11RR19 pKa = 11.84NGMSTIAKK27 pKa = 8.97IVKK30 pKa = 9.82HH31 pKa = 5.0STANRR36 pKa = 3.51
MM1 pKa = 7.2NVAILANPAIDD12 pKa = 3.52HH13 pKa = 6.54AVVKK17 pKa = 9.88YY18 pKa = 10.11RR19 pKa = 11.84NGMSTIAKK27 pKa = 8.97IVKK30 pKa = 9.82HH31 pKa = 5.0STANRR36 pKa = 3.51
Molecular weight: 3.91 kDa
Isoelectric point according different methods:
Peptides (in silico digests for buttom-up proteomics)
Below you can find in silico digests of the whole proteome with Trypsin, Chymotrypsin, Trypsin+LysC, LysN, ArgC proteases suitable for different mass spec machines.| Try ESI |
 |
|---|
| ChTry ESI |
|
|---|
| ArgC ESI |
|
|---|
| LysN ESI |
|
|---|
| TryLysC ESI |
|
|---|
| Try MALDI |
|
|---|
| ChTry MALDI |
|
|---|
| ArgC MALDI |
|
|---|
| LysN MALDI |
|
|---|
| TryLysC MALDI |
|
|---|
| Try LTQ |
|
|---|
| ChTry LTQ |
|
|---|
| ArgC LTQ |
|
|---|
| LysN LTQ |
|
|---|
| TryLysC LTQ |
|
|---|
| Try MSlow |
|
|---|
| ChTry MSlow |
|
|---|
| ArgC MSlow |
|
|---|
| LysN MSlow |
|
|---|
| TryLysC MSlow |
|
|---|
| Try MShigh |
|
|---|
| ChTry MShigh |
|
|---|
| ArgC MShigh |
|
|---|
| LysN MShigh |
|
|---|
| TryLysC MShigh |
|
|---|
General Statistics
Number of major isoforms |
Number of additional isoforms |
Number of all proteins |
Number of amino acids |
Min. Seq. Length |
Max. Seq. Length |
Avg. Seq. Length |
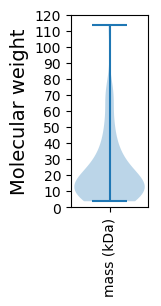
Avg. Mol. Weight |
|---|---|---|---|---|---|---|---|
0 |
13118 |
35 |
1047 |
201.8 |
23.09 |
Amino acid frequency
Ala |
Cys |
Asp |
Glu |
Phe |
Gly |
His |
Ile |
Lys |
Leu |
|---|---|---|---|---|---|---|---|---|---|
5.794 ± 0.362 | 0.549 ± 0.099 |
6.038 ± 0.304 | 7.494 ± 0.398 |
4.322 ± 0.25 | 5.916 ± 0.32 |
1.845 ± 0.134 | 7.311 ± 0.282 |
9.148 ± 0.334 | 7.333 ± 0.211 |
Met |
Asn |
Gln |
Pro |
Arg |
Ser |
Thr |
Val |
Trp |
Tyr |
|---|---|---|---|---|---|---|---|---|---|
2.592 ± 0.196 | 6.602 ± 0.28 |
2.798 ± 0.219 | 4.353 ± 0.211 |
4.025 ± 0.21 | 5.755 ± 0.26 |
6.289 ± 0.256 | 6.266 ± 0.251 |
1.22 ± 0.161 | 4.353 ± 0.339 |
Most of the basic statistics you can see at this page can be downloaded from this CSV file
See this proteome in:

Proteome-pI is available under Creative Commons Attribution-NoDerivs license, for more details see here
| Reference: Kozlowski LP. Proteome-pI 2.0: Proteome Isoelectric Point Database Update. Nucleic Acids Res. 2021, doi: 10.1093/nar/gkab944 | Contact: Lukasz P. Kozlowski |