Rhizobium tubonense
Taxonomy: cellular organisms; Bacteria; Proteobacteria; Alphaproteobacteria; Hyphomicrobiales; Rhizobiaceae; Rhizobium/Agrobacterium group; Rhizobium
Average proteome isoelectric point is 6.47
Get precalculated fractions of proteins
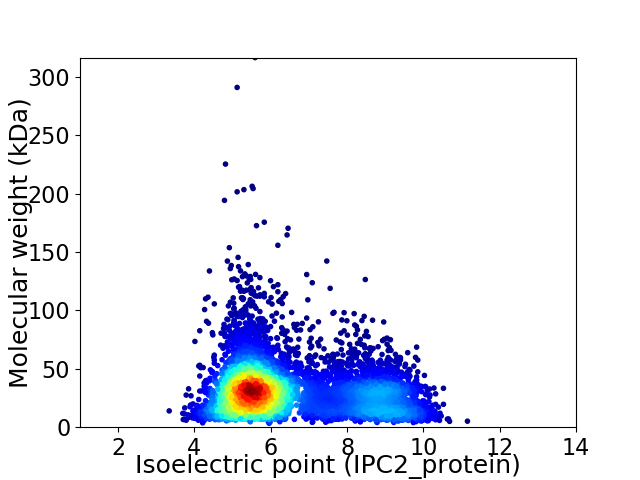
Virtual 2D-PAGE plot for 6043 proteins (isoelectric point calculated using IPC2_protein)
Get csv file with sequences according to given criteria:
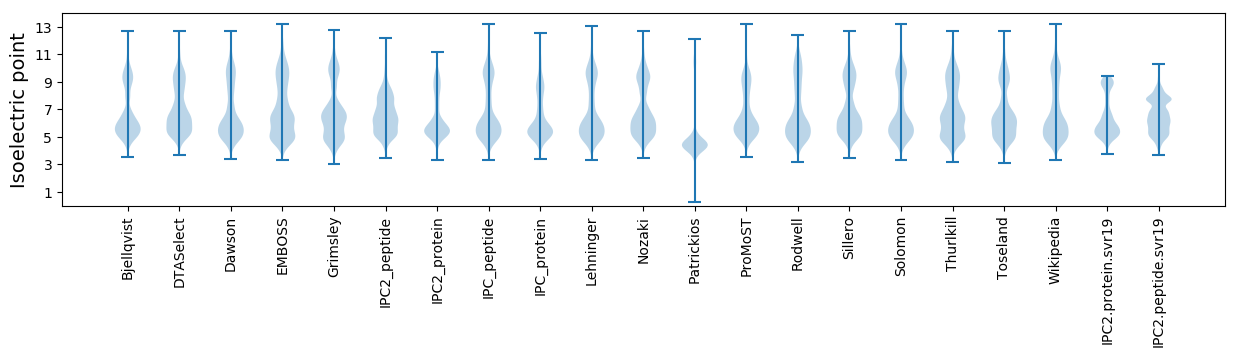
* You can choose from 21 different methods for calculating isoelectric point
Summary statistics related to proteome-wise predictions
Protein with the lowest isoelectric point:
>tr|A0A2W4CZZ1|A0A2W4CZZ1_9RHIZ DNA repair exonuclease OS=Rhizobium tubonense OX=484088 GN=CPY51_00960 PE=4 SV=1
MM1 pKa = 7.65TDD3 pKa = 3.17DD4 pKa = 3.69HH5 pKa = 7.49SKK7 pKa = 10.61VAALADD13 pKa = 3.87GFANSAVNSTNIDD26 pKa = 3.66DD27 pKa = 4.62GSTGLVGVGNSSNSHH42 pKa = 6.29NDD44 pKa = 2.76NSTDD48 pKa = 3.39TTNTDD53 pKa = 2.9ASQTNGNGDD62 pKa = 3.62NRR64 pKa = 11.84DD65 pKa = 3.1NSYY68 pKa = 11.77DD69 pKa = 3.56FDD71 pKa = 4.74SKK73 pKa = 11.93VNTTTNDD80 pKa = 2.56ITSSYY85 pKa = 9.82NHH87 pKa = 6.61QDD89 pKa = 2.74TDD91 pKa = 3.87TKK93 pKa = 10.07VTSITDD99 pKa = 3.46TKK101 pKa = 11.21DD102 pKa = 2.96SYY104 pKa = 10.6NTSTKK109 pKa = 10.87DD110 pKa = 2.85SGNAYY115 pKa = 10.09NYY117 pKa = 10.02SDD119 pKa = 3.65SSTHH123 pKa = 6.35VKK125 pKa = 10.55DD126 pKa = 4.04SNNSLSEE133 pKa = 4.31SYY135 pKa = 10.59TKK137 pKa = 10.83DD138 pKa = 2.91SGNYY142 pKa = 9.11SSDD145 pKa = 3.16SSTHH149 pKa = 5.99SSSDD153 pKa = 3.37YY154 pKa = 11.6DD155 pKa = 4.0FGTLKK160 pKa = 10.86DD161 pKa = 3.31IGEE164 pKa = 4.18VSGNVGIAGGDD175 pKa = 3.46LAFNLGDD182 pKa = 4.18DD183 pKa = 3.85YY184 pKa = 11.92SFNLNLDD191 pKa = 4.07NILNNSLNGDD201 pKa = 3.76GNHH204 pKa = 6.68TGFSLVQANNLADD217 pKa = 3.78QDD219 pKa = 3.79TAYY222 pKa = 10.71NVSMNNAHH230 pKa = 6.63AHH232 pKa = 6.23NDD234 pKa = 3.42LSSEE238 pKa = 4.05GGDD241 pKa = 3.2AHH243 pKa = 7.52SDD245 pKa = 3.0AGIGFDD251 pKa = 5.93SKK253 pKa = 11.36LSWDD257 pKa = 3.69PSTPVAGHH265 pKa = 7.29DD266 pKa = 3.58LTGTSTADD274 pKa = 3.13SSSILANSGYY284 pKa = 9.77HH285 pKa = 5.28QEE287 pKa = 4.2LVQGANMVSNTSDD300 pKa = 2.94IAITGGDD307 pKa = 3.41HH308 pKa = 7.4HH309 pKa = 7.48DD310 pKa = 3.72VTTSSS315 pKa = 3.17
MM1 pKa = 7.65TDD3 pKa = 3.17DD4 pKa = 3.69HH5 pKa = 7.49SKK7 pKa = 10.61VAALADD13 pKa = 3.87GFANSAVNSTNIDD26 pKa = 3.66DD27 pKa = 4.62GSTGLVGVGNSSNSHH42 pKa = 6.29NDD44 pKa = 2.76NSTDD48 pKa = 3.39TTNTDD53 pKa = 2.9ASQTNGNGDD62 pKa = 3.62NRR64 pKa = 11.84DD65 pKa = 3.1NSYY68 pKa = 11.77DD69 pKa = 3.56FDD71 pKa = 4.74SKK73 pKa = 11.93VNTTTNDD80 pKa = 2.56ITSSYY85 pKa = 9.82NHH87 pKa = 6.61QDD89 pKa = 2.74TDD91 pKa = 3.87TKK93 pKa = 10.07VTSITDD99 pKa = 3.46TKK101 pKa = 11.21DD102 pKa = 2.96SYY104 pKa = 10.6NTSTKK109 pKa = 10.87DD110 pKa = 2.85SGNAYY115 pKa = 10.09NYY117 pKa = 10.02SDD119 pKa = 3.65SSTHH123 pKa = 6.35VKK125 pKa = 10.55DD126 pKa = 4.04SNNSLSEE133 pKa = 4.31SYY135 pKa = 10.59TKK137 pKa = 10.83DD138 pKa = 2.91SGNYY142 pKa = 9.11SSDD145 pKa = 3.16SSTHH149 pKa = 5.99SSSDD153 pKa = 3.37YY154 pKa = 11.6DD155 pKa = 4.0FGTLKK160 pKa = 10.86DD161 pKa = 3.31IGEE164 pKa = 4.18VSGNVGIAGGDD175 pKa = 3.46LAFNLGDD182 pKa = 4.18DD183 pKa = 3.85YY184 pKa = 11.92SFNLNLDD191 pKa = 4.07NILNNSLNGDD201 pKa = 3.76GNHH204 pKa = 6.68TGFSLVQANNLADD217 pKa = 3.78QDD219 pKa = 3.79TAYY222 pKa = 10.71NVSMNNAHH230 pKa = 6.63AHH232 pKa = 6.23NDD234 pKa = 3.42LSSEE238 pKa = 4.05GGDD241 pKa = 3.2AHH243 pKa = 7.52SDD245 pKa = 3.0AGIGFDD251 pKa = 5.93SKK253 pKa = 11.36LSWDD257 pKa = 3.69PSTPVAGHH265 pKa = 7.29DD266 pKa = 3.58LTGTSTADD274 pKa = 3.13SSSILANSGYY284 pKa = 9.77HH285 pKa = 5.28QEE287 pKa = 4.2LVQGANMVSNTSDD300 pKa = 2.94IAITGGDD307 pKa = 3.41HH308 pKa = 7.4HH309 pKa = 7.48DD310 pKa = 3.72VTTSSS315 pKa = 3.17
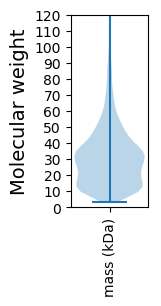
Molecular weight: 32.83 kDa
Isoelectric point according different methods:
Protein with the highest isoelectric point:
>tr|A0A2W4ELE6|A0A2W4ELE6_9RHIZ DNA-binding response regulator OS=Rhizobium tubonense OX=484088 GN=CPY51_10220 PE=4 SV=1
MM1 pKa = 7.35KK2 pKa = 9.43RR3 pKa = 11.84TYY5 pKa = 10.27QPSKK9 pKa = 9.43LVRR12 pKa = 11.84ARR14 pKa = 11.84RR15 pKa = 11.84HH16 pKa = 4.38GFRR19 pKa = 11.84ARR21 pKa = 11.84MATKK25 pKa = 10.22GGRR28 pKa = 11.84KK29 pKa = 9.51VIIARR34 pKa = 11.84RR35 pKa = 11.84ARR37 pKa = 11.84GRR39 pKa = 11.84KK40 pKa = 9.03RR41 pKa = 11.84LSAA44 pKa = 4.03
MM1 pKa = 7.35KK2 pKa = 9.43RR3 pKa = 11.84TYY5 pKa = 10.27QPSKK9 pKa = 9.43LVRR12 pKa = 11.84ARR14 pKa = 11.84RR15 pKa = 11.84HH16 pKa = 4.38GFRR19 pKa = 11.84ARR21 pKa = 11.84MATKK25 pKa = 10.22GGRR28 pKa = 11.84KK29 pKa = 9.51VIIARR34 pKa = 11.84RR35 pKa = 11.84ARR37 pKa = 11.84GRR39 pKa = 11.84KK40 pKa = 9.03RR41 pKa = 11.84LSAA44 pKa = 4.03
Molecular weight: 5.15 kDa
Isoelectric point according different methods:
Peptides (in silico digests for buttom-up proteomics)
Below you can find in silico digests of the whole proteome with Trypsin, Chymotrypsin, Trypsin+LysC, LysN, ArgC proteases suitable for different mass spec machines.| Try ESI |
 |
|---|
| ChTry ESI |
|
|---|
| ArgC ESI |
|
|---|
| LysN ESI |
|
|---|
| TryLysC ESI |
|
|---|
| Try MALDI |
|
|---|
| ChTry MALDI |
|
|---|
| ArgC MALDI |
|
|---|
| LysN MALDI |
|
|---|
| TryLysC MALDI |
|
|---|
| Try LTQ |
|
|---|
| ChTry LTQ |
|
|---|
| ArgC LTQ |
|
|---|
| LysN LTQ |
|
|---|
| TryLysC LTQ |
|
|---|
| Try MSlow |
|
|---|
| ChTry MSlow |
|
|---|
| ArgC MSlow |
|
|---|
| LysN MSlow |
|
|---|
| TryLysC MSlow |
|
|---|
| Try MShigh |
|
|---|
| ChTry MShigh |
|
|---|
| ArgC MShigh |
|
|---|
| LysN MShigh |
|
|---|
| TryLysC MShigh |
|
|---|
General Statistics
Number of major isoforms |
Number of additional isoforms |
Number of all proteins |
Number of amino acids |
Min. Seq. Length |
Max. Seq. Length |
Avg. Seq. Length |
Avg. Mol. Weight |
|---|---|---|---|---|---|---|---|
0 |
1816925 |
29 |
2834 |
300.7 |
32.74 |
Amino acid frequency
Ala |
Cys |
Asp |
Glu |
Phe |
Gly |
His |
Ile |
Lys |
Leu |
|---|---|---|---|---|---|---|---|---|---|
11.555 ± 0.038 | 0.808 ± 0.009 |
5.758 ± 0.025 | 5.562 ± 0.031 |
3.967 ± 0.021 | 8.234 ± 0.027 |
2.048 ± 0.015 | 5.835 ± 0.025 |
3.813 ± 0.027 | 9.924 ± 0.037 |
Met |
Asn |
Gln |
Pro |
Arg |
Ser |
Thr |
Val |
Trp |
Tyr |
|---|---|---|---|---|---|---|---|---|---|
2.565 ± 0.015 | 2.97 ± 0.021 |
4.83 ± 0.022 | 3.152 ± 0.021 |
6.507 ± 0.031 | 6.061 ± 0.024 |
5.418 ± 0.021 | 7.373 ± 0.026 |
1.289 ± 0.012 | 2.332 ± 0.015 |
Most of the basic statistics you can see at this page can be downloaded from this CSV file
See this proteome in:

Proteome-pI is available under Creative Commons Attribution-NoDerivs license, for more details see here
| Reference: Kozlowski LP. Proteome-pI 2.0: Proteome Isoelectric Point Database Update. Nucleic Acids Res. 2021, doi: 10.1093/nar/gkab944 | Contact: Lukasz P. Kozlowski |