Aggregatibacter phage S1249
Taxonomy: Viruses; Duplodnaviria; Heunggongvirae; Uroviricota; Caudoviricetes; Caudovirales; Myoviridae; unclassified Myoviridae
Average proteome isoelectric point is 6.78
Get precalculated fractions of proteins
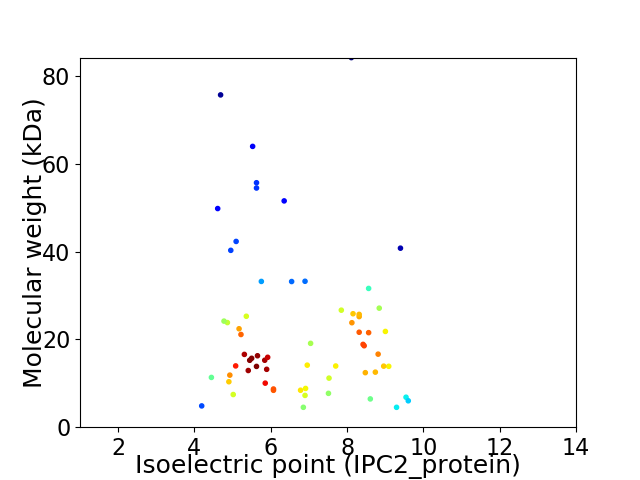
Virtual 2D-PAGE plot for 66 proteins (isoelectric point calculated using IPC2_protein)
Get csv file with sequences according to given criteria:
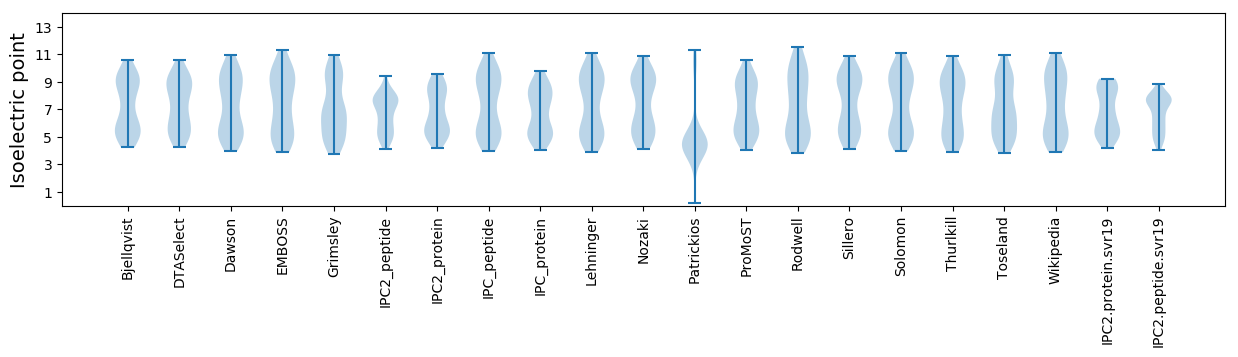
* You can choose from 21 different methods for calculating isoelectric point
Summary statistics related to proteome-wise predictions
Protein with the lowest isoelectric point:
>tr|D0UIN2|D0UIN2_9CAUD Uncharacterized protein OS=Aggregatibacter phage S1249 OX=683735 GN=D11S_2270 PE=4 SV=1
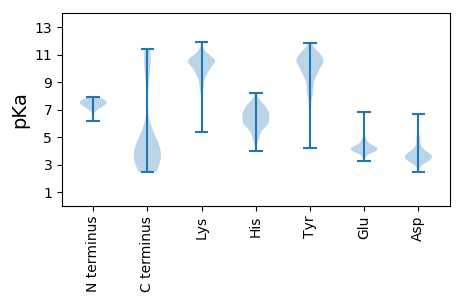
MM1 pKa = 7.8DD2 pKa = 6.51LIEE5 pKa = 4.99GMSRR9 pKa = 11.84DD10 pKa = 3.64DD11 pKa = 4.73SMTSLHH17 pKa = 6.75CSGDD21 pKa = 3.33ANSYY25 pKa = 9.87YY26 pKa = 10.42RR27 pKa = 11.84VTEE30 pKa = 4.0TPEE33 pKa = 4.36EE34 pKa = 3.92ILEE37 pKa = 4.28TMKK40 pKa = 10.49PAEE43 pKa = 4.05
MM1 pKa = 7.8DD2 pKa = 6.51LIEE5 pKa = 4.99GMSRR9 pKa = 11.84DD10 pKa = 3.64DD11 pKa = 4.73SMTSLHH17 pKa = 6.75CSGDD21 pKa = 3.33ANSYY25 pKa = 9.87YY26 pKa = 10.42RR27 pKa = 11.84VTEE30 pKa = 4.0TPEE33 pKa = 4.36EE34 pKa = 3.92ILEE37 pKa = 4.28TMKK40 pKa = 10.49PAEE43 pKa = 4.05
Molecular weight: 4.85 kDa
Isoelectric point according different methods:
Protein with the highest isoelectric point:
>tr|D0UIM2|D0UIM2_9CAUD Uncharacterized protein OS=Aggregatibacter phage S1249 OX=683735 GN=D11S_2260 PE=4 SV=1
MM1 pKa = 7.28NGWGKK6 pKa = 8.44LTLRR10 pKa = 11.84CEE12 pKa = 4.52CLRR15 pKa = 11.84KK16 pKa = 9.81CKK18 pKa = 9.99QSQWVGIAKK27 pKa = 10.0RR28 pKa = 11.84KK29 pKa = 8.49QPNHH33 pKa = 5.69TFLSVFKK40 pKa = 10.58LVKK43 pKa = 10.1NGKK46 pKa = 8.52ATDD49 pKa = 3.53SKK51 pKa = 11.29RR52 pKa = 3.32
MM1 pKa = 7.28NGWGKK6 pKa = 8.44LTLRR10 pKa = 11.84CEE12 pKa = 4.52CLRR15 pKa = 11.84KK16 pKa = 9.81CKK18 pKa = 9.99QSQWVGIAKK27 pKa = 10.0RR28 pKa = 11.84KK29 pKa = 8.49QPNHH33 pKa = 5.69TFLSVFKK40 pKa = 10.58LVKK43 pKa = 10.1NGKK46 pKa = 8.52ATDD49 pKa = 3.53SKK51 pKa = 11.29RR52 pKa = 3.32
Molecular weight: 6.02 kDa
Isoelectric point according different methods:
Peptides (in silico digests for buttom-up proteomics)
Below you can find in silico digests of the whole proteome with Trypsin, Chymotrypsin, Trypsin+LysC, LysN, ArgC proteases suitable for different mass spec machines.| Try ESI |
 |
|---|
| ChTry ESI |
|
|---|
| ArgC ESI |
|
|---|
| LysN ESI |
|
|---|
| TryLysC ESI |
|
|---|
| Try MALDI |
|
|---|
| ChTry MALDI |
|
|---|
| ArgC MALDI |
|
|---|
| LysN MALDI |
|
|---|
| TryLysC MALDI |
|
|---|
| Try LTQ |
|
|---|
| ChTry LTQ |
|
|---|
| ArgC LTQ |
|
|---|
| LysN LTQ |
|
|---|
| TryLysC LTQ |
|
|---|
| Try MSlow |
|
|---|
| ChTry MSlow |
|
|---|
| ArgC MSlow |
|
|---|
| LysN MSlow |
|
|---|
| TryLysC MSlow |
|
|---|
| Try MShigh |
|
|---|
| ChTry MShigh |
|
|---|
| ArgC MShigh |
|
|---|
| LysN MShigh |
|
|---|
| TryLysC MShigh |
|
|---|
General Statistics
Number of major isoforms |
Number of additional isoforms |
Number of all proteins |
Number of amino acids |
Min. Seq. Length |
Max. Seq. Length |
Avg. Seq. Length |
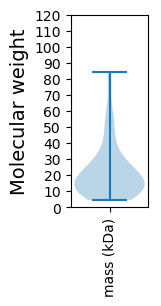
Avg. Mol. Weight |
|---|---|---|---|---|---|---|---|
0 |
13153 |
38 |
757 |
199.3 |
22.35 |
Amino acid frequency
Ala |
Cys |
Asp |
Glu |
Phe |
Gly |
His |
Ile |
Lys |
Leu |
|---|---|---|---|---|---|---|---|---|---|
8.447 ± 0.343 | 1.042 ± 0.141 |
5.991 ± 0.217 | 6.341 ± 0.286 |
4.151 ± 0.186 | 6.47 ± 0.275 |
1.589 ± 0.142 | 6.957 ± 0.245 |
7.603 ± 0.324 | 8.698 ± 0.279 |
Met |
Asn |
Gln |
Pro |
Arg |
Ser |
Thr |
Val |
Trp |
Tyr |
|---|---|---|---|---|---|---|---|---|---|
2.129 ± 0.14 | 5.428 ± 0.281 |
2.927 ± 0.177 | 5.094 ± 0.189 |
4.6 ± 0.25 | 6.219 ± 0.257 |
5.824 ± 0.213 | 6.014 ± 0.205 |
1.475 ± 0.132 | 3.003 ± 0.179 |
Most of the basic statistics you can see at this page can be downloaded from this CSV file
See this proteome in:

Proteome-pI is available under Creative Commons Attribution-NoDerivs license, for more details see here
| Reference: Kozlowski LP. Proteome-pI 2.0: Proteome Isoelectric Point Database Update. Nucleic Acids Res. 2021, doi: 10.1093/nar/gkab944 | Contact: Lukasz P. Kozlowski |