Spirobacillus cienkowskii
Taxonomy: cellular organisms; Bacteria; Proteobacteria; Oligoflexia; Silvanigrellales; Silvanigrellales incertae sedis; Spirobacillus
Average proteome isoelectric point is 7.26
Get precalculated fractions of proteins
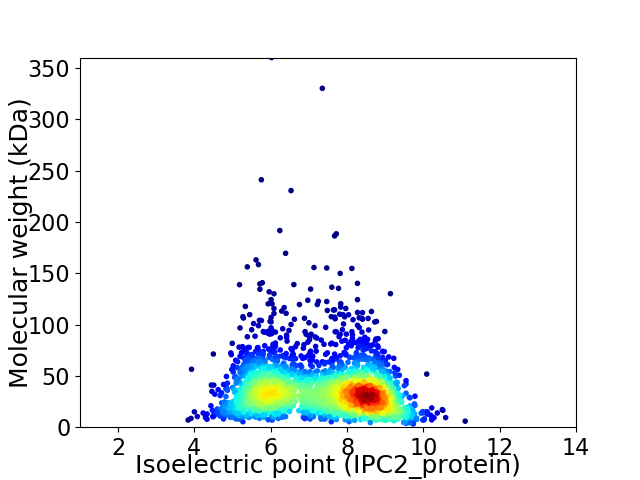
Virtual 2D-PAGE plot for 2415 proteins (isoelectric point calculated using IPC2_protein)
Get csv file with sequences according to given criteria:
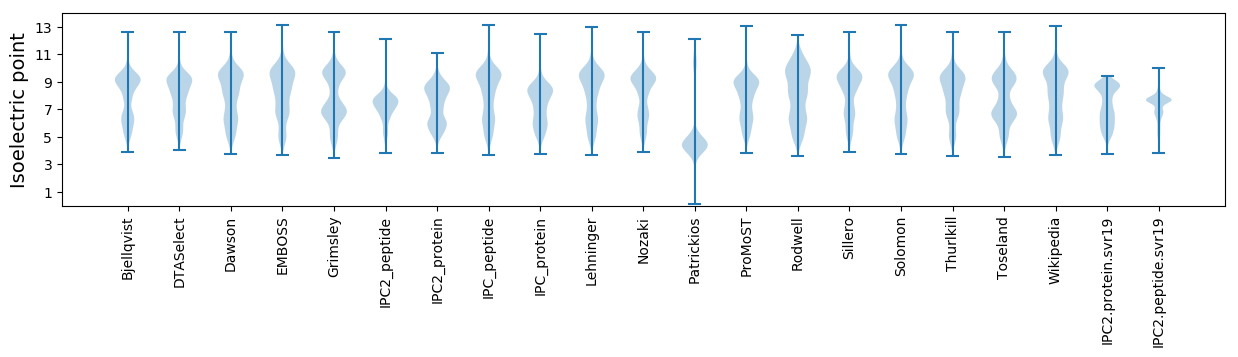
* You can choose from 21 different methods for calculating isoelectric point
Summary statistics related to proteome-wise predictions
Protein with the lowest isoelectric point:
>tr|A0A369KRI3|A0A369KRI3_9PROT ATP-dependent zinc metalloprotease FtsH OS=Spirobacillus cienkowskii OX=495820 GN=hflB PE=3 SV=1
MM1 pKa = 7.68KK2 pKa = 10.6NIDD5 pKa = 3.66QYY7 pKa = 12.26NLIKK11 pKa = 10.97NFIDD15 pKa = 3.64EE16 pKa = 4.81KK17 pKa = 10.59ISPGVLAHH25 pKa = 6.47GGEE28 pKa = 4.35VNIISLEE35 pKa = 4.04NNILTLEE42 pKa = 4.18LSGSCGSCSIQAYY55 pKa = 7.24TSEE58 pKa = 4.71SISNYY63 pKa = 9.31ILEE66 pKa = 4.87EE67 pKa = 4.29FPDD70 pKa = 4.49LDD72 pKa = 4.41DD73 pKa = 6.08VIVSDD78 pKa = 4.3
MM1 pKa = 7.68KK2 pKa = 10.6NIDD5 pKa = 3.66QYY7 pKa = 12.26NLIKK11 pKa = 10.97NFIDD15 pKa = 3.64EE16 pKa = 4.81KK17 pKa = 10.59ISPGVLAHH25 pKa = 6.47GGEE28 pKa = 4.35VNIISLEE35 pKa = 4.04NNILTLEE42 pKa = 4.18LSGSCGSCSIQAYY55 pKa = 7.24TSEE58 pKa = 4.71SISNYY63 pKa = 9.31ILEE66 pKa = 4.87EE67 pKa = 4.29FPDD70 pKa = 4.49LDD72 pKa = 4.41DD73 pKa = 6.08VIVSDD78 pKa = 4.3
Molecular weight: 8.55 kDa
Isoelectric point according different methods:
Protein with the highest isoelectric point:
>tr|A0A369KW62|A0A369KW62_9PROT ATP-dependent helicase OS=Spirobacillus cienkowskii OX=495820 GN=DCC88_01785 PE=4 SV=1
MM1 pKa = 7.69SKK3 pKa = 9.01RR4 pKa = 11.84TFQPSNKK11 pKa = 8.51VRR13 pKa = 11.84KK14 pKa = 8.93RR15 pKa = 11.84KK16 pKa = 9.52HH17 pKa = 4.47GFRR20 pKa = 11.84ARR22 pKa = 11.84MATKK26 pKa = 10.28NGRR29 pKa = 11.84NIIKK33 pKa = 10.2RR34 pKa = 11.84RR35 pKa = 11.84RR36 pKa = 11.84SKK38 pKa = 10.88GRR40 pKa = 11.84SLLAATVYY48 pKa = 10.81VKK50 pKa = 10.96
MM1 pKa = 7.69SKK3 pKa = 9.01RR4 pKa = 11.84TFQPSNKK11 pKa = 8.51VRR13 pKa = 11.84KK14 pKa = 8.93RR15 pKa = 11.84KK16 pKa = 9.52HH17 pKa = 4.47GFRR20 pKa = 11.84ARR22 pKa = 11.84MATKK26 pKa = 10.28NGRR29 pKa = 11.84NIIKK33 pKa = 10.2RR34 pKa = 11.84RR35 pKa = 11.84RR36 pKa = 11.84SKK38 pKa = 10.88GRR40 pKa = 11.84SLLAATVYY48 pKa = 10.81VKK50 pKa = 10.96
Molecular weight: 5.89 kDa
Isoelectric point according different methods:
Peptides (in silico digests for buttom-up proteomics)
Below you can find in silico digests of the whole proteome with Trypsin, Chymotrypsin, Trypsin+LysC, LysN, ArgC proteases suitable for different mass spec machines.| Try ESI |
 |
|---|
| ChTry ESI |
|
|---|
| ArgC ESI |
|
|---|
| LysN ESI |
|
|---|
| TryLysC ESI |
|
|---|
| Try MALDI |
|
|---|
| ChTry MALDI |
|
|---|
| ArgC MALDI |
|
|---|
| LysN MALDI |
|
|---|
| TryLysC MALDI |
|
|---|
| Try LTQ |
|
|---|
| ChTry LTQ |
|
|---|
| ArgC LTQ |
|
|---|
| LysN LTQ |
|
|---|
| TryLysC LTQ |
|
|---|
| Try MSlow |
|
|---|
| ChTry MSlow |
|
|---|
| ArgC MSlow |
|
|---|
| LysN MSlow |
|
|---|
| TryLysC MSlow |
|
|---|
| Try MShigh |
|
|---|
| ChTry MShigh |
|
|---|
| ArgC MShigh |
|
|---|
| LysN MShigh |
|
|---|
| TryLysC MShigh |
|
|---|
General Statistics
Number of major isoforms |
Number of additional isoforms |
Number of all proteins |
Number of amino acids |
Min. Seq. Length |
Max. Seq. Length |
Avg. Seq. Length |
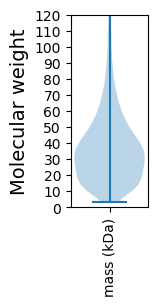
Avg. Mol. Weight |
|---|---|---|---|---|---|---|---|
0 |
824229 |
27 |
3432 |
341.3 |
38.69 |
Amino acid frequency
Ala |
Cys |
Asp |
Glu |
Phe |
Gly |
His |
Ile |
Lys |
Leu |
|---|---|---|---|---|---|---|---|---|---|
6.059 ± 0.055 | 1.21 ± 0.018 |
4.579 ± 0.029 | 6.3 ± 0.048 |
5.675 ± 0.046 | 5.289 ± 0.044 |
1.95 ± 0.025 | 8.805 ± 0.05 |
8.268 ± 0.049 | 9.972 ± 0.049 |
Met |
Asn |
Gln |
Pro |
Arg |
Ser |
Thr |
Val |
Trp |
Tyr |
|---|---|---|---|---|---|---|---|---|---|
1.961 ± 0.02 | 6.798 ± 0.061 |
3.431 ± 0.029 | 3.675 ± 0.03 |
3.502 ± 0.036 | 7.55 ± 0.047 |
4.923 ± 0.047 | 5.552 ± 0.04 |
0.945 ± 0.014 | 3.558 ± 0.035 |
Most of the basic statistics you can see at this page can be downloaded from this CSV file
See this proteome in:

Proteome-pI is available under Creative Commons Attribution-NoDerivs license, for more details see here
| Reference: Kozlowski LP. Proteome-pI 2.0: Proteome Isoelectric Point Database Update. Nucleic Acids Res. 2021, doi: 10.1093/nar/gkab944 | Contact: Lukasz P. Kozlowski |