Ruminococcus sp. CAG:353
Taxonomy: cellular organisms; Bacteria; Terrabacteria group; Firmicutes; Clostridia; Eubacteriales; Oscillospiraceae; Ruminococcus; environmental samples
Average proteome isoelectric point is 5.91
Get precalculated fractions of proteins
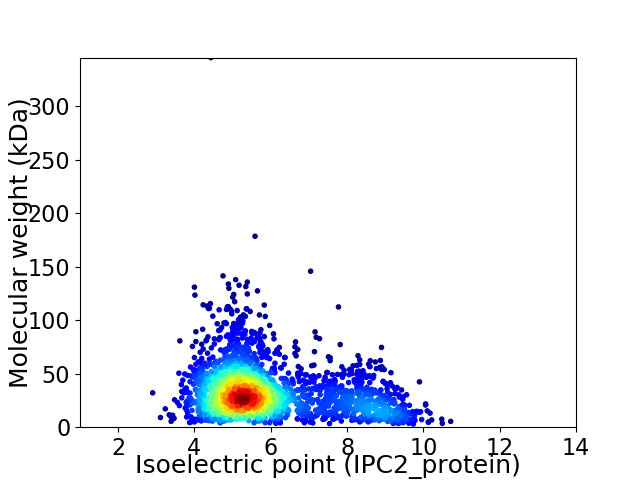
Virtual 2D-PAGE plot for 2331 proteins (isoelectric point calculated using IPC2_protein)
Get csv file with sequences according to given criteria:
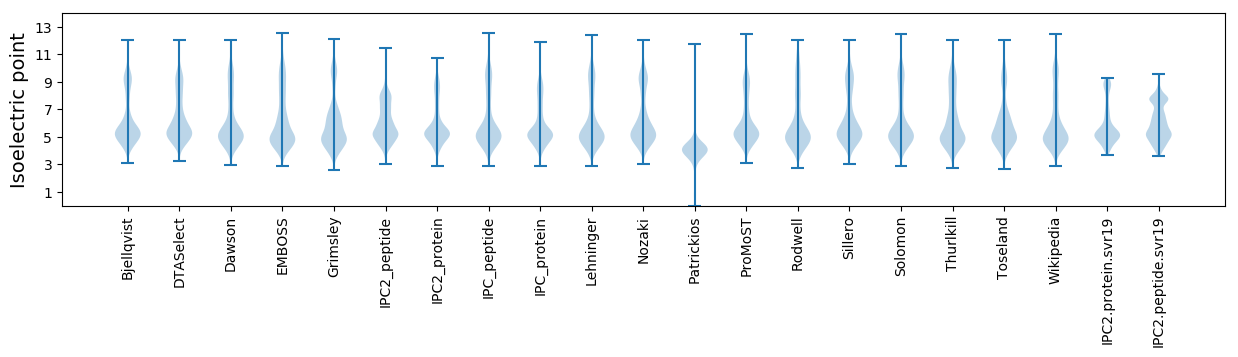
* You can choose from 21 different methods for calculating isoelectric point
Summary statistics related to proteome-wise predictions
Protein with the lowest isoelectric point:
>tr|R7L0T1|R7L0T1_9FIRM Uncharacterized protein OS=Ruminococcus sp. CAG:353 OX=1262955 GN=BN622_02179 PE=4 SV=1
MM1 pKa = 7.66LLLCSCTAISEE12 pKa = 4.34NEE14 pKa = 4.13DD15 pKa = 3.74ALPAAATVAEE25 pKa = 4.2PQPYY29 pKa = 9.0PVEE32 pKa = 4.15EE33 pKa = 4.51GNLIFNSSPVTVGSLSPAVTEE54 pKa = 4.41MIYY57 pKa = 10.72EE58 pKa = 4.47LGYY61 pKa = 10.8GDD63 pKa = 5.46RR64 pKa = 11.84LICRR68 pKa = 11.84SSYY71 pKa = 10.88CDD73 pKa = 3.16TPEE76 pKa = 4.1AVLSLPEE83 pKa = 4.24TGSAANPDD91 pKa = 3.01VDD93 pKa = 5.6KK94 pKa = 10.84IISYY98 pKa = 10.66APEE101 pKa = 3.92LLITQSPIANKK112 pKa = 9.09DD113 pKa = 3.5TVRR116 pKa = 11.84LSEE119 pKa = 4.51AGISLLTLPAPTSLEE134 pKa = 3.94EE135 pKa = 5.34LYY137 pKa = 11.2DD138 pKa = 3.82NYY140 pKa = 11.45AALADD145 pKa = 3.84IFAGSIEE152 pKa = 4.25GNSLAEE158 pKa = 3.98NTLADD163 pKa = 3.62MKK165 pKa = 10.99SAVNEE170 pKa = 4.08AKK172 pKa = 10.4SSCEE176 pKa = 3.85SIVFIMNIDD185 pKa = 3.47GDD187 pKa = 4.61EE188 pKa = 4.13ITAGTGDD195 pKa = 4.03SFAGDD200 pKa = 4.05LFSVFGRR207 pKa = 11.84NIAEE211 pKa = 4.11NDD213 pKa = 2.96TDD215 pKa = 3.82YY216 pKa = 11.4TITAEE221 pKa = 4.25EE222 pKa = 5.06LIKK225 pKa = 10.68ADD227 pKa = 3.4PQYY230 pKa = 11.31IFLARR235 pKa = 11.84PLSASDD241 pKa = 3.77FDD243 pKa = 5.01SEE245 pKa = 5.02LAEE248 pKa = 3.95QLSAFSEE255 pKa = 4.23DD256 pKa = 3.42HH257 pKa = 6.33VFSIDD262 pKa = 3.09ASLTEE267 pKa = 4.4RR268 pKa = 11.84PTARR272 pKa = 11.84LAEE275 pKa = 4.57TIRR278 pKa = 11.84SVSEE282 pKa = 3.85VMTDD286 pKa = 3.14TNAEE290 pKa = 4.15TTEE293 pKa = 4.05FTGGYY298 pKa = 10.31AEE300 pKa = 3.81IHH302 pKa = 5.63EE303 pKa = 4.57TSEE306 pKa = 3.84QQ307 pKa = 3.36
MM1 pKa = 7.66LLLCSCTAISEE12 pKa = 4.34NEE14 pKa = 4.13DD15 pKa = 3.74ALPAAATVAEE25 pKa = 4.2PQPYY29 pKa = 9.0PVEE32 pKa = 4.15EE33 pKa = 4.51GNLIFNSSPVTVGSLSPAVTEE54 pKa = 4.41MIYY57 pKa = 10.72EE58 pKa = 4.47LGYY61 pKa = 10.8GDD63 pKa = 5.46RR64 pKa = 11.84LICRR68 pKa = 11.84SSYY71 pKa = 10.88CDD73 pKa = 3.16TPEE76 pKa = 4.1AVLSLPEE83 pKa = 4.24TGSAANPDD91 pKa = 3.01VDD93 pKa = 5.6KK94 pKa = 10.84IISYY98 pKa = 10.66APEE101 pKa = 3.92LLITQSPIANKK112 pKa = 9.09DD113 pKa = 3.5TVRR116 pKa = 11.84LSEE119 pKa = 4.51AGISLLTLPAPTSLEE134 pKa = 3.94EE135 pKa = 5.34LYY137 pKa = 11.2DD138 pKa = 3.82NYY140 pKa = 11.45AALADD145 pKa = 3.84IFAGSIEE152 pKa = 4.25GNSLAEE158 pKa = 3.98NTLADD163 pKa = 3.62MKK165 pKa = 10.99SAVNEE170 pKa = 4.08AKK172 pKa = 10.4SSCEE176 pKa = 3.85SIVFIMNIDD185 pKa = 3.47GDD187 pKa = 4.61EE188 pKa = 4.13ITAGTGDD195 pKa = 4.03SFAGDD200 pKa = 4.05LFSVFGRR207 pKa = 11.84NIAEE211 pKa = 4.11NDD213 pKa = 2.96TDD215 pKa = 3.82YY216 pKa = 11.4TITAEE221 pKa = 4.25EE222 pKa = 5.06LIKK225 pKa = 10.68ADD227 pKa = 3.4PQYY230 pKa = 11.31IFLARR235 pKa = 11.84PLSASDD241 pKa = 3.77FDD243 pKa = 5.01SEE245 pKa = 5.02LAEE248 pKa = 3.95QLSAFSEE255 pKa = 4.23DD256 pKa = 3.42HH257 pKa = 6.33VFSIDD262 pKa = 3.09ASLTEE267 pKa = 4.4RR268 pKa = 11.84PTARR272 pKa = 11.84LAEE275 pKa = 4.57TIRR278 pKa = 11.84SVSEE282 pKa = 3.85VMTDD286 pKa = 3.14TNAEE290 pKa = 4.15TTEE293 pKa = 4.05FTGGYY298 pKa = 10.31AEE300 pKa = 3.81IHH302 pKa = 5.63EE303 pKa = 4.57TSEE306 pKa = 3.84QQ307 pKa = 3.36
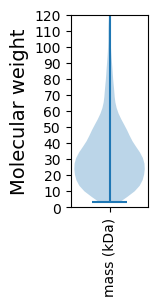
Molecular weight: 32.81 kDa
Isoelectric point according different methods:
Protein with the highest isoelectric point:
>tr|R7KW74|R7KW74_9FIRM Polyribonucleotide nucleotidyltransferase OS=Ruminococcus sp. CAG:353 OX=1262955 GN=pnp PE=3 SV=1
MM1 pKa = 7.82AKK3 pKa = 9.58TSMKK7 pKa = 9.97IKK9 pKa = 9.16QQRR12 pKa = 11.84TPKK15 pKa = 10.22YY16 pKa = 8.2STRR19 pKa = 11.84AYY21 pKa = 10.04NRR23 pKa = 11.84CKK25 pKa = 10.13ICGRR29 pKa = 11.84PHH31 pKa = 7.56AYY33 pKa = 8.38MRR35 pKa = 11.84KK36 pKa = 9.44FGICRR41 pKa = 11.84ICFRR45 pKa = 11.84EE46 pKa = 4.1LAHH49 pKa = 6.87KK50 pKa = 10.13GQIPGVKK57 pKa = 9.25KK58 pKa = 10.9ASWW61 pKa = 3.03
MM1 pKa = 7.82AKK3 pKa = 9.58TSMKK7 pKa = 9.97IKK9 pKa = 9.16QQRR12 pKa = 11.84TPKK15 pKa = 10.22YY16 pKa = 8.2STRR19 pKa = 11.84AYY21 pKa = 10.04NRR23 pKa = 11.84CKK25 pKa = 10.13ICGRR29 pKa = 11.84PHH31 pKa = 7.56AYY33 pKa = 8.38MRR35 pKa = 11.84KK36 pKa = 9.44FGICRR41 pKa = 11.84ICFRR45 pKa = 11.84EE46 pKa = 4.1LAHH49 pKa = 6.87KK50 pKa = 10.13GQIPGVKK57 pKa = 9.25KK58 pKa = 10.9ASWW61 pKa = 3.03
Molecular weight: 7.16 kDa
Isoelectric point according different methods:
Peptides (in silico digests for buttom-up proteomics)
Below you can find in silico digests of the whole proteome with Trypsin, Chymotrypsin, Trypsin+LysC, LysN, ArgC proteases suitable for different mass spec machines.| Try ESI |
 |
|---|
| ChTry ESI |
|
|---|
| ArgC ESI |
|
|---|
| LysN ESI |
|
|---|
| TryLysC ESI |
|
|---|
| Try MALDI |
|
|---|
| ChTry MALDI |
|
|---|
| ArgC MALDI |
|
|---|
| LysN MALDI |
|
|---|
| TryLysC MALDI |
|
|---|
| Try LTQ |
|
|---|
| ChTry LTQ |
|
|---|
| ArgC LTQ |
|
|---|
| LysN LTQ |
|
|---|
| TryLysC LTQ |
|
|---|
| Try MSlow |
|
|---|
| ChTry MSlow |
|
|---|
| ArgC MSlow |
|
|---|
| LysN MSlow |
|
|---|
| TryLysC MSlow |
|
|---|
| Try MShigh |
|
|---|
| ChTry MShigh |
|
|---|
| ArgC MShigh |
|
|---|
| LysN MShigh |
|
|---|
| TryLysC MShigh |
|
|---|
General Statistics
Number of major isoforms |
Number of additional isoforms |
Number of all proteins |
Number of amino acids |
Min. Seq. Length |
Max. Seq. Length |
Avg. Seq. Length |
Avg. Mol. Weight |
|---|---|---|---|---|---|---|---|
0 |
717514 |
29 |
3240 |
307.8 |
34.19 |
Amino acid frequency
Ala |
Cys |
Asp |
Glu |
Phe |
Gly |
His |
Ile |
Lys |
Leu |
|---|---|---|---|---|---|---|---|---|---|
8.382 ± 0.052 | 1.814 ± 0.024 |
6.281 ± 0.043 | 6.929 ± 0.051 |
4.215 ± 0.036 | 7.068 ± 0.049 |
1.586 ± 0.019 | 7.562 ± 0.042 |
6.598 ± 0.043 | 8.111 ± 0.049 |
Met |
Asn |
Gln |
Pro |
Arg |
Ser |
Thr |
Val |
Trp |
Tyr |
|---|---|---|---|---|---|---|---|---|---|
3.083 ± 0.025 | 4.429 ± 0.04 |
3.412 ± 0.029 | 2.397 ± 0.023 |
4.229 ± 0.036 | 6.682 ± 0.048 |
5.598 ± 0.041 | 6.7 ± 0.038 |
0.789 ± 0.018 | 4.13 ± 0.039 |
Most of the basic statistics you can see at this page can be downloaded from this CSV file
See this proteome in:

Proteome-pI is available under Creative Commons Attribution-NoDerivs license, for more details see here
| Reference: Kozlowski LP. Proteome-pI 2.0: Proteome Isoelectric Point Database Update. Nucleic Acids Res. 2021, doi: 10.1093/nar/gkab944 | Contact: Lukasz P. Kozlowski |