Escherichia phage megetsur
Taxonomy: Viruses; Duplodnaviria; Heunggongvirae; Uroviricota; Caudoviricetes; Caudovirales; Autographiviridae; Bonnellvirus; unclassified Bonnellvirus
Average proteome isoelectric point is 5.84
Get precalculated fractions of proteins
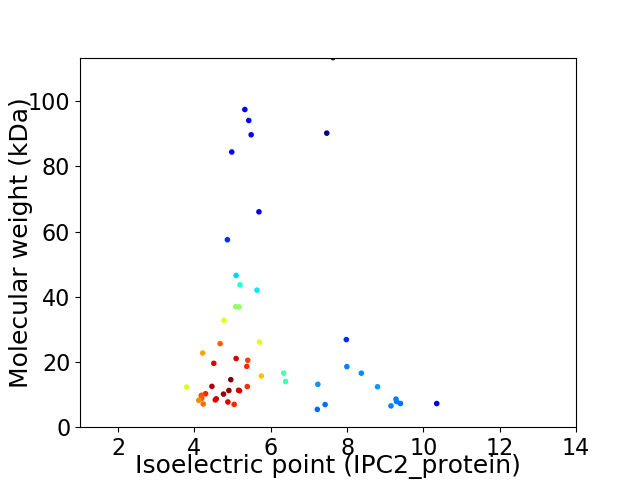
Virtual 2D-PAGE plot for 54 proteins (isoelectric point calculated using IPC2_protein)
Get csv file with sequences according to given criteria:
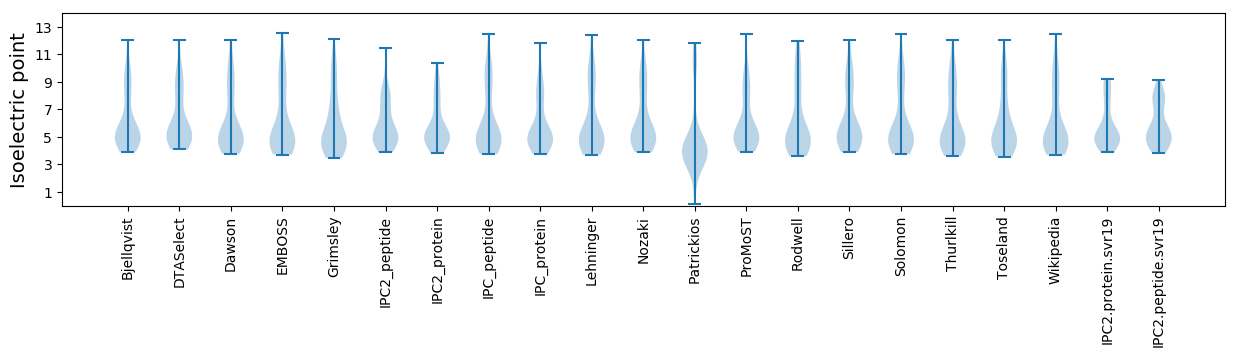
* You can choose from 21 different methods for calculating isoelectric point
Summary statistics related to proteome-wise predictions
Protein with the lowest isoelectric point:
>tr|A0A6C6XYV8|A0A6C6XYV8_9CAUD Putative Rz1A protein OS=Escherichia phage megetsur OX=2696417 GN=megetsur_51 PE=4 SV=1
MM1 pKa = 7.47ALVDD5 pKa = 3.57STAAEE10 pKa = 3.86RR11 pKa = 11.84AEE13 pKa = 5.0FVAACNMAAKK23 pKa = 9.82YY24 pKa = 10.73LNVWTEE30 pKa = 4.4DD31 pKa = 3.66YY32 pKa = 11.2FFDD35 pKa = 3.72TTNTEE40 pKa = 3.85LVVYY44 pKa = 8.54YY45 pKa = 9.81QEE47 pKa = 4.26SVTRR51 pKa = 11.84VQTALTNLTNAAAA64 pKa = 4.26
MM1 pKa = 7.47ALVDD5 pKa = 3.57STAAEE10 pKa = 3.86RR11 pKa = 11.84AEE13 pKa = 5.0FVAACNMAAKK23 pKa = 9.82YY24 pKa = 10.73LNVWTEE30 pKa = 4.4DD31 pKa = 3.66YY32 pKa = 11.2FFDD35 pKa = 3.72TTNTEE40 pKa = 3.85LVVYY44 pKa = 8.54YY45 pKa = 9.81QEE47 pKa = 4.26SVTRR51 pKa = 11.84VQTALTNLTNAAAA64 pKa = 4.26
Molecular weight: 7.12 kDa
Isoelectric point according different methods:
Protein with the highest isoelectric point:
>tr|A0A6C6XYU0|A0A6C6XYU0_9CAUD Uncharacterized protein OS=Escherichia phage megetsur OX=2696417 GN=megetsur_33 PE=4 SV=1
MM1 pKa = 7.6SVLLWIVAVVWFALFSVVWLRR22 pKa = 11.84VTSTTRR28 pKa = 11.84HH29 pKa = 5.2TLTGLVQQDD38 pKa = 4.01LSCGYY43 pKa = 10.05SWLSSLLFCLPVLRR57 pKa = 11.84RR58 pKa = 11.84RR59 pKa = 11.84LYY61 pKa = 9.0EE62 pKa = 4.13SLSKK66 pKa = 10.79SHH68 pKa = 6.73
MM1 pKa = 7.6SVLLWIVAVVWFALFSVVWLRR22 pKa = 11.84VTSTTRR28 pKa = 11.84HH29 pKa = 5.2TLTGLVQQDD38 pKa = 4.01LSCGYY43 pKa = 10.05SWLSSLLFCLPVLRR57 pKa = 11.84RR58 pKa = 11.84RR59 pKa = 11.84LYY61 pKa = 9.0EE62 pKa = 4.13SLSKK66 pKa = 10.79SHH68 pKa = 6.73
Molecular weight: 7.87 kDa
Isoelectric point according different methods:
Peptides (in silico digests for buttom-up proteomics)
Below you can find in silico digests of the whole proteome with Trypsin, Chymotrypsin, Trypsin+LysC, LysN, ArgC proteases suitable for different mass spec machines.| Try ESI |
 |
|---|
| ChTry ESI |
|
|---|
| ArgC ESI |
|
|---|
| LysN ESI |
|
|---|
| TryLysC ESI |
|
|---|
| Try MALDI |
|
|---|
| ChTry MALDI |
|
|---|
| ArgC MALDI |
|
|---|
| LysN MALDI |
|
|---|
| TryLysC MALDI |
|
|---|
| Try LTQ |
|
|---|
| ChTry LTQ |
|
|---|
| ArgC LTQ |
|
|---|
| LysN LTQ |
|
|---|
| TryLysC LTQ |
|
|---|
| Try MSlow |
|
|---|
| ChTry MSlow |
|
|---|
| ArgC MSlow |
|
|---|
| LysN MSlow |
|
|---|
| TryLysC MSlow |
|
|---|
| Try MShigh |
|
|---|
| ChTry MShigh |
|
|---|
| ArgC MShigh |
|
|---|
| LysN MShigh |
|
|---|
| TryLysC MShigh |
|
|---|
General Statistics
Number of major isoforms |
Number of additional isoforms |
Number of all proteins |
Number of amino acids |
Min. Seq. Length |
Max. Seq. Length |
Avg. Seq. Length |
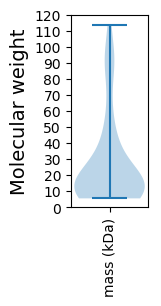
Avg. Mol. Weight |
|---|---|---|---|---|---|---|---|
0 |
13160 |
50 |
1034 |
243.7 |
26.89 |
Amino acid frequency
Ala |
Cys |
Asp |
Glu |
Phe |
Gly |
His |
Ile |
Lys |
Leu |
|---|---|---|---|---|---|---|---|---|---|
10.395 ± 0.517 | 0.919 ± 0.146 |
6.018 ± 0.256 | 6.185 ± 0.318 |
3.412 ± 0.219 | 7.865 ± 0.345 |
1.869 ± 0.186 | 4.65 ± 0.226 |
4.369 ± 0.272 | 8.131 ± 0.262 |
Met |
Asn |
Gln |
Pro |
Arg |
Ser |
Thr |
Val |
Trp |
Tyr |
|---|---|---|---|---|---|---|---|---|---|
2.964 ± 0.275 | 4.271 ± 0.276 |
4.271 ± 0.347 | 4.985 ± 0.5 |
5.585 ± 0.268 | 5.79 ± 0.279 |
6.155 ± 0.369 | 7.188 ± 0.309 |
1.451 ± 0.132 | 3.526 ± 0.27 |
Most of the basic statistics you can see at this page can be downloaded from this CSV file
See this proteome in:

Proteome-pI is available under Creative Commons Attribution-NoDerivs license, for more details see here
| Reference: Kozlowski LP. Proteome-pI 2.0: Proteome Isoelectric Point Database Update. Nucleic Acids Res. 2021, doi: 10.1093/nar/gkab944 | Contact: Lukasz P. Kozlowski |