Micromonospora yangpuensis
Taxonomy: cellular organisms; Bacteria; Terrabacteria group; Actinobacteria; Actinomycetia; Micromonosporales; Micromonosporaceae; Micromonospora
Average proteome isoelectric point is 6.63
Get precalculated fractions of proteins
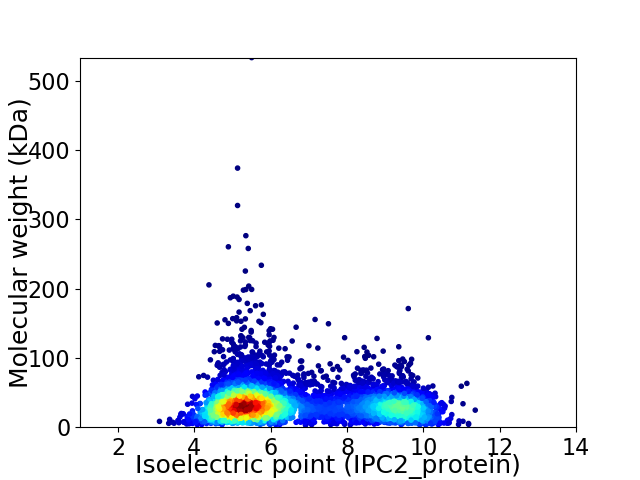
Virtual 2D-PAGE plot for 5740 proteins (isoelectric point calculated using IPC2_protein)
Get csv file with sequences according to given criteria:
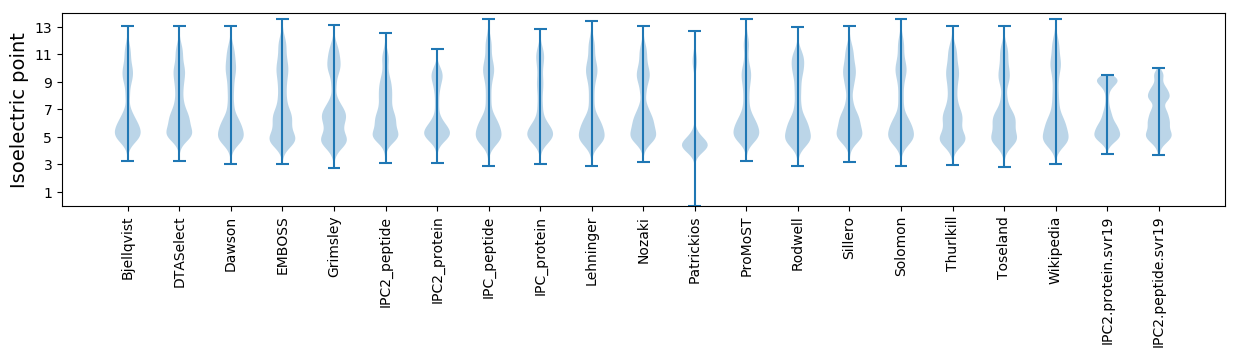
* You can choose from 21 different methods for calculating isoelectric point
Summary statistics related to proteome-wise predictions
Protein with the lowest isoelectric point:
>tr|A0A1C6U1K1|A0A1C6U1K1_9ACTN Methyltransferase domain-containing protein OS=Micromonospora yangpuensis OX=683228 GN=GA0070617_0678 PE=4 SV=1
MM1 pKa = 6.79VTDD4 pKa = 4.27IYY6 pKa = 10.83QVQGMTCGHH15 pKa = 6.85CVQAVSAEE23 pKa = 4.07VGALAGVDD31 pKa = 3.73EE32 pKa = 4.67VQVDD36 pKa = 4.22LASGQVTVTSAEE48 pKa = 4.1PLDD51 pKa = 4.14PAAVRR56 pKa = 11.84AAVDD60 pKa = 3.18EE61 pKa = 4.62AGYY64 pKa = 11.07DD65 pKa = 3.55LVDD68 pKa = 3.32RR69 pKa = 5.17
MM1 pKa = 6.79VTDD4 pKa = 4.27IYY6 pKa = 10.83QVQGMTCGHH15 pKa = 6.85CVQAVSAEE23 pKa = 4.07VGALAGVDD31 pKa = 3.73EE32 pKa = 4.67VQVDD36 pKa = 4.22LASGQVTVTSAEE48 pKa = 4.1PLDD51 pKa = 4.14PAAVRR56 pKa = 11.84AAVDD60 pKa = 3.18EE61 pKa = 4.62AGYY64 pKa = 11.07DD65 pKa = 3.55LVDD68 pKa = 3.32RR69 pKa = 5.17
Molecular weight: 7.06 kDa
Isoelectric point according different methods:
Protein with the highest isoelectric point:
>tr|A0A1C6VCN6|A0A1C6VCN6_9ACTN GntR family transcriptional regulator OS=Micromonospora yangpuensis OX=683228 GN=GA0070617_5304 PE=4 SV=1
MM1 pKa = 7.28GSVVKK6 pKa = 10.49KK7 pKa = 9.45RR8 pKa = 11.84RR9 pKa = 11.84KK10 pKa = 9.48RR11 pKa = 11.84MAKK14 pKa = 9.41KK15 pKa = 9.87KK16 pKa = 9.7HH17 pKa = 5.84RR18 pKa = 11.84KK19 pKa = 8.7LLRR22 pKa = 11.84KK23 pKa = 7.84TRR25 pKa = 11.84VQRR28 pKa = 11.84RR29 pKa = 11.84RR30 pKa = 11.84LGKK33 pKa = 10.04
MM1 pKa = 7.28GSVVKK6 pKa = 10.49KK7 pKa = 9.45RR8 pKa = 11.84RR9 pKa = 11.84KK10 pKa = 9.48RR11 pKa = 11.84MAKK14 pKa = 9.41KK15 pKa = 9.87KK16 pKa = 9.7HH17 pKa = 5.84RR18 pKa = 11.84KK19 pKa = 8.7LLRR22 pKa = 11.84KK23 pKa = 7.84TRR25 pKa = 11.84VQRR28 pKa = 11.84RR29 pKa = 11.84RR30 pKa = 11.84LGKK33 pKa = 10.04
Molecular weight: 4.12 kDa
Isoelectric point according different methods:
Peptides (in silico digests for buttom-up proteomics)
Below you can find in silico digests of the whole proteome with Trypsin, Chymotrypsin, Trypsin+LysC, LysN, ArgC proteases suitable for different mass spec machines.| Try ESI |
 |
|---|
| ChTry ESI |
|
|---|
| ArgC ESI |
|
|---|
| LysN ESI |
|
|---|
| TryLysC ESI |
|
|---|
| Try MALDI |
|
|---|
| ChTry MALDI |
|
|---|
| ArgC MALDI |
|
|---|
| LysN MALDI |
|
|---|
| TryLysC MALDI |
|
|---|
| Try LTQ |
|
|---|
| ChTry LTQ |
|
|---|
| ArgC LTQ |
|
|---|
| LysN LTQ |
|
|---|
| TryLysC LTQ |
|
|---|
| Try MSlow |
|
|---|
| ChTry MSlow |
|
|---|
| ArgC MSlow |
|
|---|
| LysN MSlow |
|
|---|
| TryLysC MSlow |
|
|---|
| Try MShigh |
|
|---|
| ChTry MShigh |
|
|---|
| ArgC MShigh |
|
|---|
| LysN MShigh |
|
|---|
| TryLysC MShigh |
|
|---|
General Statistics
Number of major isoforms |
Number of additional isoforms |
Number of all proteins |
Number of amino acids |
Min. Seq. Length |
Max. Seq. Length |
Avg. Seq. Length |
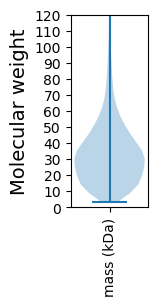
Avg. Mol. Weight |
|---|---|---|---|---|---|---|---|
0 |
1903892 |
31 |
5074 |
331.7 |
35.44 |
Amino acid frequency
Ala |
Cys |
Asp |
Glu |
Phe |
Gly |
His |
Ile |
Lys |
Leu |
|---|---|---|---|---|---|---|---|---|---|
13.744 ± 0.049 | 0.738 ± 0.009 |
6.064 ± 0.032 | 4.982 ± 0.029 |
2.587 ± 0.018 | 9.464 ± 0.029 |
2.155 ± 0.018 | 3.045 ± 0.02 |
1.526 ± 0.024 | 10.469 ± 0.041 |
Met |
Asn |
Gln |
Pro |
Arg |
Ser |
Thr |
Val |
Trp |
Tyr |
|---|---|---|---|---|---|---|---|---|---|
1.526 ± 0.011 | 1.772 ± 0.019 |
6.555 ± 0.036 | 2.923 ± 0.02 |
8.633 ± 0.039 | 4.734 ± 0.025 |
6.434 ± 0.029 | 9.067 ± 0.032 |
1.545 ± 0.014 | 2.038 ± 0.015 |
Most of the basic statistics you can see at this page can be downloaded from this CSV file
See this proteome in:

Proteome-pI is available under Creative Commons Attribution-NoDerivs license, for more details see here
| Reference: Kozlowski LP. Proteome-pI 2.0: Proteome Isoelectric Point Database Update. Nucleic Acids Res. 2021, doi: 10.1093/nar/gkab944 | Contact: Lukasz P. Kozlowski |