Moraxellaceae bacterium HYN0046
Taxonomy: cellular organisms; Bacteria; Proteobacteria; Gammaproteobacteria; Pseudomonadales; Moraxellaceae; Aquirhabdus
Average proteome isoelectric point is 6.51
Get precalculated fractions of proteins
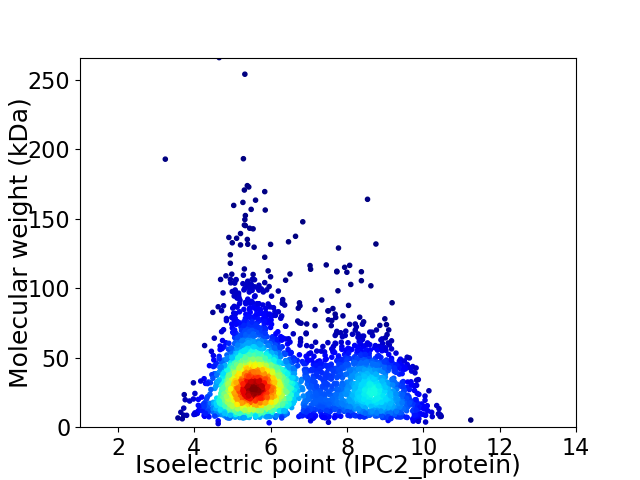
Virtual 2D-PAGE plot for 3297 proteins (isoelectric point calculated using IPC2_protein)
Get csv file with sequences according to given criteria:
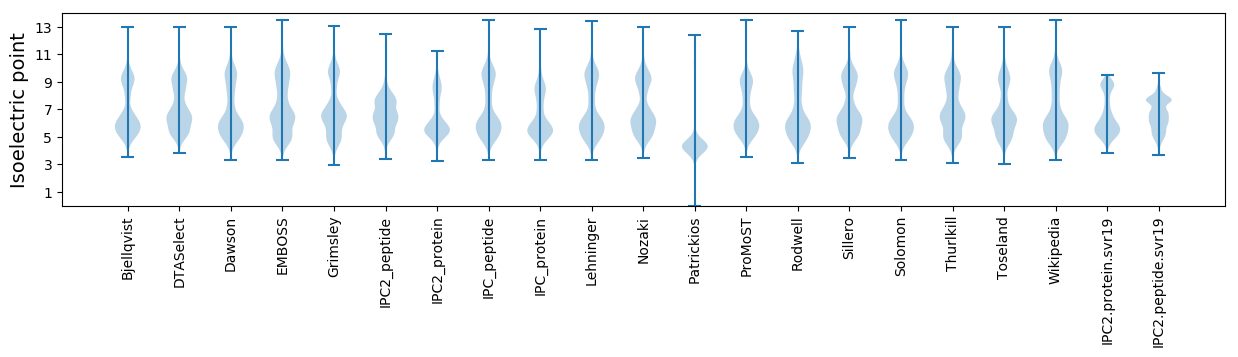
* You can choose from 21 different methods for calculating isoelectric point
Summary statistics related to proteome-wise predictions
Protein with the lowest isoelectric point:
>tr|A0A345P682|A0A345P682_9GAMM Rhodanese domain-containing protein OS=Moraxellaceae bacterium HYN0046 OX=2283318 GN=HYN46_08055 PE=4 SV=1
MM1 pKa = 7.7KK2 pKa = 10.11KK3 pKa = 9.69YY4 pKa = 10.65QCIVCGWIYY13 pKa = 11.06DD14 pKa = 4.1EE15 pKa = 5.82AIGWPDD21 pKa = 3.5DD22 pKa = 4.45GIPAGTLWDD31 pKa = 5.92DD32 pKa = 4.69IPDD35 pKa = 3.34SWVCPDD41 pKa = 4.2CGVGKK46 pKa = 10.5ADD48 pKa = 3.78FEE50 pKa = 4.63MIEE53 pKa = 4.07VV54 pKa = 3.62
MM1 pKa = 7.7KK2 pKa = 10.11KK3 pKa = 9.69YY4 pKa = 10.65QCIVCGWIYY13 pKa = 11.06DD14 pKa = 4.1EE15 pKa = 5.82AIGWPDD21 pKa = 3.5DD22 pKa = 4.45GIPAGTLWDD31 pKa = 5.92DD32 pKa = 4.69IPDD35 pKa = 3.34SWVCPDD41 pKa = 4.2CGVGKK46 pKa = 10.5ADD48 pKa = 3.78FEE50 pKa = 4.63MIEE53 pKa = 4.07VV54 pKa = 3.62
Molecular weight: 6.05 kDa
Isoelectric point according different methods:
Protein with the highest isoelectric point:
>tr|A0A345PAM8|A0A345PAM8_9GAMM Ribosome maturation factor RimP OS=Moraxellaceae bacterium HYN0046 OX=2283318 GN=rimP PE=3 SV=1
MM1 pKa = 7.45KK2 pKa = 9.53RR3 pKa = 11.84TFQPSSLKK11 pKa = 10.08RR12 pKa = 11.84KK13 pKa = 8.62RR14 pKa = 11.84VHH16 pKa = 6.43GFRR19 pKa = 11.84ARR21 pKa = 11.84MATKK25 pKa = 10.35NGRR28 pKa = 11.84LVLARR33 pKa = 11.84RR34 pKa = 11.84RR35 pKa = 11.84AKK37 pKa = 10.22GRR39 pKa = 11.84ARR41 pKa = 11.84LTVV44 pKa = 3.04
MM1 pKa = 7.45KK2 pKa = 9.53RR3 pKa = 11.84TFQPSSLKK11 pKa = 10.08RR12 pKa = 11.84KK13 pKa = 8.62RR14 pKa = 11.84VHH16 pKa = 6.43GFRR19 pKa = 11.84ARR21 pKa = 11.84MATKK25 pKa = 10.35NGRR28 pKa = 11.84LVLARR33 pKa = 11.84RR34 pKa = 11.84RR35 pKa = 11.84AKK37 pKa = 10.22GRR39 pKa = 11.84ARR41 pKa = 11.84LTVV44 pKa = 3.04
Molecular weight: 5.16 kDa
Isoelectric point according different methods:
Peptides (in silico digests for buttom-up proteomics)
Below you can find in silico digests of the whole proteome with Trypsin, Chymotrypsin, Trypsin+LysC, LysN, ArgC proteases suitable for different mass spec machines.| Try ESI |
 |
|---|
| ChTry ESI |
|
|---|
| ArgC ESI |
|
|---|
| LysN ESI |
|
|---|
| TryLysC ESI |
|
|---|
| Try MALDI |
|
|---|
| ChTry MALDI |
|
|---|
| ArgC MALDI |
|
|---|
| LysN MALDI |
|
|---|
| TryLysC MALDI |
|
|---|
| Try LTQ |
|
|---|
| ChTry LTQ |
|
|---|
| ArgC LTQ |
|
|---|
| LysN LTQ |
|
|---|
| TryLysC LTQ |
|
|---|
| Try MSlow |
|
|---|
| ChTry MSlow |
|
|---|
| ArgC MSlow |
|
|---|
| LysN MSlow |
|
|---|
| TryLysC MSlow |
|
|---|
| Try MShigh |
|
|---|
| ChTry MShigh |
|
|---|
| ArgC MShigh |
|
|---|
| LysN MShigh |
|
|---|
| TryLysC MShigh |
|
|---|
General Statistics
Number of major isoforms |
Number of additional isoforms |
Number of all proteins |
Number of amino acids |
Min. Seq. Length |
Max. Seq. Length |
Avg. Seq. Length |
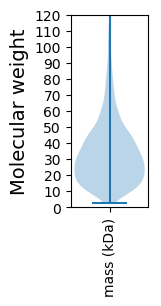
Avg. Mol. Weight |
|---|---|---|---|---|---|---|---|
0 |
1068716 |
22 |
2422 |
324.1 |
35.7 |
Amino acid frequency
Ala |
Cys |
Asp |
Glu |
Phe |
Gly |
His |
Ile |
Lys |
Leu |
|---|---|---|---|---|---|---|---|---|---|
9.69 ± 0.043 | 0.823 ± 0.014 |
5.331 ± 0.035 | 5.095 ± 0.047 |
3.938 ± 0.031 | 7.152 ± 0.04 |
2.439 ± 0.026 | 6.262 ± 0.036 |
4.471 ± 0.04 | 10.574 ± 0.057 |
Met |
Asn |
Gln |
Pro |
Arg |
Ser |
Thr |
Val |
Trp |
Tyr |
|---|---|---|---|---|---|---|---|---|---|
2.365 ± 0.021 | 3.908 ± 0.034 |
4.57 ± 0.027 | 4.626 ± 0.034 |
5.016 ± 0.036 | 6.577 ± 0.076 |
5.943 ± 0.04 | 7.014 ± 0.036 |
1.32 ± 0.017 | 2.887 ± 0.031 |
Most of the basic statistics you can see at this page can be downloaded from this CSV file
See this proteome in:

Proteome-pI is available under Creative Commons Attribution-NoDerivs license, for more details see here
| Reference: Kozlowski LP. Proteome-pI 2.0: Proteome Isoelectric Point Database Update. Nucleic Acids Res. 2021, doi: 10.1093/nar/gkab944 | Contact: Lukasz P. Kozlowski |