Spirosoma montaniterrae
Taxonomy: cellular organisms; Bacteria; FCB group; Bacteroidetes/Chlorobi group; Bacteroidetes; Cytophagia; Cytophagales; Cytophagaceae; Spirosoma
Average proteome isoelectric point is 6.82
Get precalculated fractions of proteins
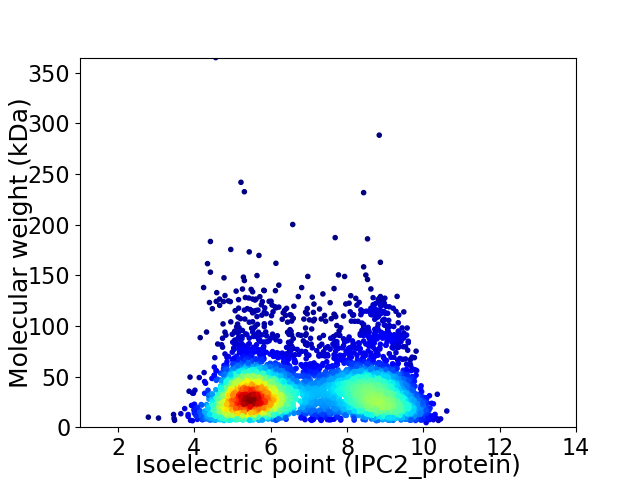
Virtual 2D-PAGE plot for 4811 proteins (isoelectric point calculated using IPC2_protein)
Get csv file with sequences according to given criteria:
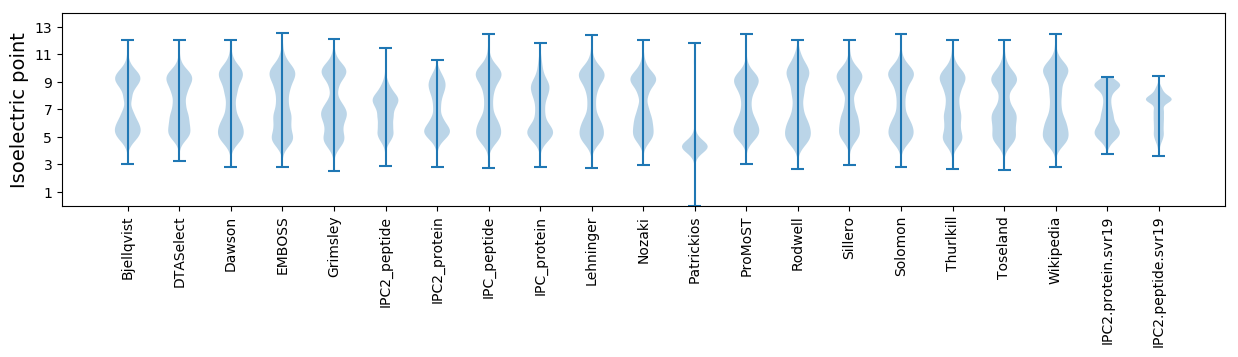
* You can choose from 21 different methods for calculating isoelectric point
Summary statistics related to proteome-wise predictions
Protein with the lowest isoelectric point:
>tr|A0A1P9WWN2|A0A1P9WWN2_9BACT GMC family oxidoreductase OS=Spirosoma montaniterrae OX=1178516 GN=AWR27_10765 PE=4 SV=1
MM1 pKa = 7.38ATYY4 pKa = 10.28KK5 pKa = 10.95NEE7 pKa = 3.93GFDD10 pKa = 3.66PEE12 pKa = 4.83EE13 pKa = 4.23INALKK18 pKa = 10.51DD19 pKa = 3.08EE20 pKa = 4.68CRR22 pKa = 11.84QEE24 pKa = 4.28GQSFVYY30 pKa = 10.97VEE32 pKa = 4.74DD33 pKa = 5.33DD34 pKa = 4.33DD35 pKa = 4.77MDD37 pKa = 3.84VLEE40 pKa = 4.84TGEE43 pKa = 4.35CVHH46 pKa = 6.29IQFPGLYY53 pKa = 9.58DD54 pKa = 3.55GQEE57 pKa = 4.05VVFDD61 pKa = 4.01ALVYY65 pKa = 8.56TLRR68 pKa = 11.84LHH70 pKa = 6.7HH71 pKa = 6.86SSLVYY76 pKa = 10.46EE77 pKa = 4.46MAVEE81 pKa = 4.54QIRR84 pKa = 11.84KK85 pKa = 7.25TYY87 pKa = 9.7PEE89 pKa = 4.24YY90 pKa = 10.99VPPEE94 pKa = 4.27DD95 pKa = 4.72RR96 pKa = 11.84PANYY100 pKa = 9.72KK101 pKa = 10.04ISPEE105 pKa = 4.01LEE107 pKa = 4.12EE108 pKa = 4.16EE109 pKa = 4.39AEE111 pKa = 4.22TALTEE116 pKa = 4.51IIDD119 pKa = 4.46EE120 pKa = 4.28IEE122 pKa = 3.82EE123 pKa = 4.43TEE125 pKa = 4.26TVKK128 pKa = 10.73VQEE131 pKa = 4.21HH132 pKa = 5.52VEE134 pKa = 3.95VDD136 pKa = 3.73LEE138 pKa = 4.12ADD140 pKa = 3.33YY141 pKa = 11.32GIALDD146 pKa = 3.4VCLNVEE152 pKa = 4.59EE153 pKa = 4.56ITDD156 pKa = 3.64EE157 pKa = 4.26VIEE160 pKa = 4.15NFIRR164 pKa = 11.84AYY166 pKa = 9.96QSNTLRR172 pKa = 11.84LDD174 pKa = 3.17NTLYY178 pKa = 11.03SFTSEE183 pKa = 4.21SEE185 pKa = 4.1EE186 pKa = 3.98
MM1 pKa = 7.38ATYY4 pKa = 10.28KK5 pKa = 10.95NEE7 pKa = 3.93GFDD10 pKa = 3.66PEE12 pKa = 4.83EE13 pKa = 4.23INALKK18 pKa = 10.51DD19 pKa = 3.08EE20 pKa = 4.68CRR22 pKa = 11.84QEE24 pKa = 4.28GQSFVYY30 pKa = 10.97VEE32 pKa = 4.74DD33 pKa = 5.33DD34 pKa = 4.33DD35 pKa = 4.77MDD37 pKa = 3.84VLEE40 pKa = 4.84TGEE43 pKa = 4.35CVHH46 pKa = 6.29IQFPGLYY53 pKa = 9.58DD54 pKa = 3.55GQEE57 pKa = 4.05VVFDD61 pKa = 4.01ALVYY65 pKa = 8.56TLRR68 pKa = 11.84LHH70 pKa = 6.7HH71 pKa = 6.86SSLVYY76 pKa = 10.46EE77 pKa = 4.46MAVEE81 pKa = 4.54QIRR84 pKa = 11.84KK85 pKa = 7.25TYY87 pKa = 9.7PEE89 pKa = 4.24YY90 pKa = 10.99VPPEE94 pKa = 4.27DD95 pKa = 4.72RR96 pKa = 11.84PANYY100 pKa = 9.72KK101 pKa = 10.04ISPEE105 pKa = 4.01LEE107 pKa = 4.12EE108 pKa = 4.16EE109 pKa = 4.39AEE111 pKa = 4.22TALTEE116 pKa = 4.51IIDD119 pKa = 4.46EE120 pKa = 4.28IEE122 pKa = 3.82EE123 pKa = 4.43TEE125 pKa = 4.26TVKK128 pKa = 10.73VQEE131 pKa = 4.21HH132 pKa = 5.52VEE134 pKa = 3.95VDD136 pKa = 3.73LEE138 pKa = 4.12ADD140 pKa = 3.33YY141 pKa = 11.32GIALDD146 pKa = 3.4VCLNVEE152 pKa = 4.59EE153 pKa = 4.56ITDD156 pKa = 3.64EE157 pKa = 4.26VIEE160 pKa = 4.15NFIRR164 pKa = 11.84AYY166 pKa = 9.96QSNTLRR172 pKa = 11.84LDD174 pKa = 3.17NTLYY178 pKa = 11.03SFTSEE183 pKa = 4.21SEE185 pKa = 4.1EE186 pKa = 3.98
Molecular weight: 21.48 kDa
Isoelectric point according different methods:
Protein with the highest isoelectric point:
>tr|A0A1P9WZN5|A0A1P9WZN5_9BACT DNA polymerase III subunit delta OS=Spirosoma montaniterrae OX=1178516 GN=AWR27_16880 PE=4 SV=1
MM1 pKa = 7.69PSSEE5 pKa = 4.14PDD7 pKa = 2.78KK8 pKa = 10.88TRR10 pKa = 11.84PIQRR14 pKa = 11.84NDD16 pKa = 2.57SFLRR20 pKa = 11.84LRR22 pKa = 11.84KK23 pKa = 9.72DD24 pKa = 2.92KK25 pKa = 11.34LMVYY29 pKa = 10.03VDD31 pKa = 3.17PHH33 pKa = 7.27FGFIRR38 pKa = 11.84QVYY41 pKa = 9.96KK42 pKa = 10.69GVFYY46 pKa = 10.54IKK48 pKa = 10.21KK49 pKa = 9.51CAYY52 pKa = 9.7CKK54 pKa = 9.8RR55 pKa = 11.84TFEE58 pKa = 4.27AKK60 pKa = 9.47RR61 pKa = 11.84RR62 pKa = 11.84HH63 pKa = 5.89AAFCSPTCQQAHH75 pKa = 4.82RR76 pKa = 11.84RR77 pKa = 11.84GRR79 pKa = 11.84NRR81 pKa = 3.12
MM1 pKa = 7.69PSSEE5 pKa = 4.14PDD7 pKa = 2.78KK8 pKa = 10.88TRR10 pKa = 11.84PIQRR14 pKa = 11.84NDD16 pKa = 2.57SFLRR20 pKa = 11.84LRR22 pKa = 11.84KK23 pKa = 9.72DD24 pKa = 2.92KK25 pKa = 11.34LMVYY29 pKa = 10.03VDD31 pKa = 3.17PHH33 pKa = 7.27FGFIRR38 pKa = 11.84QVYY41 pKa = 9.96KK42 pKa = 10.69GVFYY46 pKa = 10.54IKK48 pKa = 10.21KK49 pKa = 9.51CAYY52 pKa = 9.7CKK54 pKa = 9.8RR55 pKa = 11.84TFEE58 pKa = 4.27AKK60 pKa = 9.47RR61 pKa = 11.84RR62 pKa = 11.84HH63 pKa = 5.89AAFCSPTCQQAHH75 pKa = 4.82RR76 pKa = 11.84RR77 pKa = 11.84GRR79 pKa = 11.84NRR81 pKa = 3.12
Molecular weight: 9.74 kDa
Isoelectric point according different methods:
Peptides (in silico digests for buttom-up proteomics)
Below you can find in silico digests of the whole proteome with Trypsin, Chymotrypsin, Trypsin+LysC, LysN, ArgC proteases suitable for different mass spec machines.| Try ESI |
 |
|---|
| ChTry ESI |
|
|---|
| ArgC ESI |
|
|---|
| LysN ESI |
|
|---|
| TryLysC ESI |
|
|---|
| Try MALDI |
|
|---|
| ChTry MALDI |
|
|---|
| ArgC MALDI |
|
|---|
| LysN MALDI |
|
|---|
| TryLysC MALDI |
|
|---|
| Try LTQ |
|
|---|
| ChTry LTQ |
|
|---|
| ArgC LTQ |
|
|---|
| LysN LTQ |
|
|---|
| TryLysC LTQ |
|
|---|
| Try MSlow |
|
|---|
| ChTry MSlow |
|
|---|
| ArgC MSlow |
|
|---|
| LysN MSlow |
|
|---|
| TryLysC MSlow |
|
|---|
| Try MShigh |
|
|---|
| ChTry MShigh |
|
|---|
| ArgC MShigh |
|
|---|
| LysN MShigh |
|
|---|
| TryLysC MShigh |
|
|---|
General Statistics
Number of major isoforms |
Number of additional isoforms |
Number of all proteins |
Number of amino acids |
Min. Seq. Length |
Max. Seq. Length |
Avg. Seq. Length |
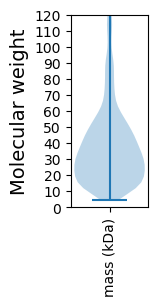
Avg. Mol. Weight |
|---|---|---|---|---|---|---|---|
0 |
1699614 |
38 |
3542 |
353.3 |
39.32 |
Amino acid frequency
Ala |
Cys |
Asp |
Glu |
Phe |
Gly |
His |
Ile |
Lys |
Leu |
|---|---|---|---|---|---|---|---|---|---|
8.68 ± 0.038 | 0.749 ± 0.01 |
5.415 ± 0.026 | 5.038 ± 0.035 |
4.497 ± 0.027 | 7.366 ± 0.037 |
1.791 ± 0.017 | 5.452 ± 0.026 |
4.325 ± 0.034 | 10.129 ± 0.037 |
Met |
Asn |
Gln |
Pro |
Arg |
Ser |
Thr |
Val |
Trp |
Tyr |
|---|---|---|---|---|---|---|---|---|---|
2.078 ± 0.015 | 4.718 ± 0.038 |
4.788 ± 0.023 | 4.488 ± 0.022 |
6.006 ± 0.029 | 5.767 ± 0.029 |
6.582 ± 0.039 | 7.098 ± 0.026 |
1.327 ± 0.012 | 3.706 ± 0.021 |
Most of the basic statistics you can see at this page can be downloaded from this CSV file
See this proteome in:

Proteome-pI is available under Creative Commons Attribution-NoDerivs license, for more details see here
| Reference: Kozlowski LP. Proteome-pI 2.0: Proteome Isoelectric Point Database Update. Nucleic Acids Res. 2021, doi: 10.1093/nar/gkab944 | Contact: Lukasz P. Kozlowski |