Paenibacillus hemerocallicola
Taxonomy: cellular organisms; Bacteria; Terrabacteria group; Firmicutes; Bacilli; Bacillales; Paenibacillaceae; Paenibacillus
Average proteome isoelectric point is 6.44
Get precalculated fractions of proteins
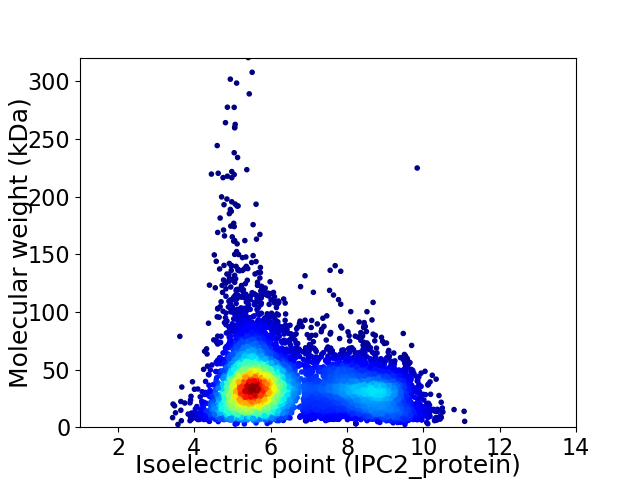
Virtual 2D-PAGE plot for 7848 proteins (isoelectric point calculated using IPC2_protein)
Get csv file with sequences according to given criteria:
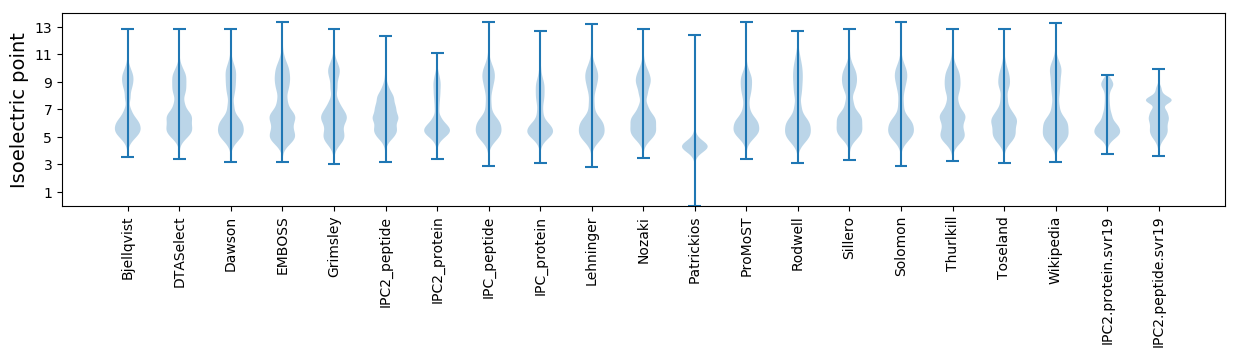
* You can choose from 21 different methods for calculating isoelectric point
Summary statistics related to proteome-wise predictions
Protein with the lowest isoelectric point:
>tr|A0A5C4SV45|A0A5C4SV45_9BACL IS3 family transposase OS=Paenibacillus hemerocallicola OX=1172614 GN=FE784_40510 PE=4 SV=1
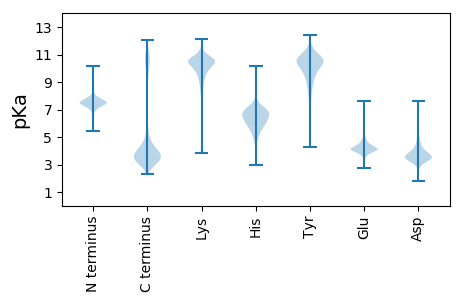
MM1 pKa = 7.38PAIVGNITILSVGPSSIVHH20 pKa = 6.38IGDD23 pKa = 5.4AIQLAPQSTSKK34 pKa = 9.6TFAGAGSFNTGDD46 pKa = 3.62AVQTYY51 pKa = 10.11NAVSSTNTYY60 pKa = 10.62DD61 pKa = 5.12ADD63 pKa = 3.7IADD66 pKa = 4.32TNAVSANGAGVLL78 pKa = 4.0
MM1 pKa = 7.38PAIVGNITILSVGPSSIVHH20 pKa = 6.38IGDD23 pKa = 5.4AIQLAPQSTSKK34 pKa = 9.6TFAGAGSFNTGDD46 pKa = 3.62AVQTYY51 pKa = 10.11NAVSSTNTYY60 pKa = 10.62DD61 pKa = 5.12ADD63 pKa = 3.7IADD66 pKa = 4.32TNAVSANGAGVLL78 pKa = 4.0
Molecular weight: 7.7 kDa
Isoelectric point according different methods:
Protein with the highest isoelectric point:
>tr|A0A5C4SXA0|A0A5C4SXA0_9BACL PNP_UDP_1 domain-containing protein OS=Paenibacillus hemerocallicola OX=1172614 GN=FE784_35730 PE=4 SV=1
MM1 pKa = 7.51FNRR4 pKa = 11.84NVRR7 pKa = 11.84VTFFSGFNFTRR18 pKa = 11.84RR19 pKa = 11.84SLTFRR24 pKa = 11.84RR25 pKa = 11.84GVAVSNLGLFGFNNIISSFRR45 pKa = 11.84LRR47 pKa = 11.84NVVIPSQVTLVLFSGRR63 pKa = 11.84NFTGNFRR70 pKa = 11.84TFRR73 pKa = 11.84GSQNISDD80 pKa = 3.43LRR82 pKa = 11.84AFNFNNVTSSFILVGFRR99 pKa = 11.84ITTSQIRR106 pKa = 11.84TIQRR110 pKa = 11.84TGRR113 pKa = 11.84MPSGISKK120 pKa = 10.35LL121 pKa = 3.71
MM1 pKa = 7.51FNRR4 pKa = 11.84NVRR7 pKa = 11.84VTFFSGFNFTRR18 pKa = 11.84RR19 pKa = 11.84SLTFRR24 pKa = 11.84RR25 pKa = 11.84GVAVSNLGLFGFNNIISSFRR45 pKa = 11.84LRR47 pKa = 11.84NVVIPSQVTLVLFSGRR63 pKa = 11.84NFTGNFRR70 pKa = 11.84TFRR73 pKa = 11.84GSQNISDD80 pKa = 3.43LRR82 pKa = 11.84AFNFNNVTSSFILVGFRR99 pKa = 11.84ITTSQIRR106 pKa = 11.84TIQRR110 pKa = 11.84TGRR113 pKa = 11.84MPSGISKK120 pKa = 10.35LL121 pKa = 3.71
Molecular weight: 13.79 kDa
Isoelectric point according different methods:
Peptides (in silico digests for buttom-up proteomics)
Below you can find in silico digests of the whole proteome with Trypsin, Chymotrypsin, Trypsin+LysC, LysN, ArgC proteases suitable for different mass spec machines.| Try ESI |
 |
|---|
| ChTry ESI |
|
|---|
| ArgC ESI |
|
|---|
| LysN ESI |
|
|---|
| TryLysC ESI |
|
|---|
| Try MALDI |
|
|---|
| ChTry MALDI |
|
|---|
| ArgC MALDI |
|
|---|
| LysN MALDI |
|
|---|
| TryLysC MALDI |
|
|---|
| Try LTQ |
|
|---|
| ChTry LTQ |
|
|---|
| ArgC LTQ |
|
|---|
| LysN LTQ |
|
|---|
| TryLysC LTQ |
|
|---|
| Try MSlow |
|
|---|
| ChTry MSlow |
|
|---|
| ArgC MSlow |
|
|---|
| LysN MSlow |
|
|---|
| TryLysC MSlow |
|
|---|
| Try MShigh |
|
|---|
| ChTry MShigh |
|
|---|
| ArgC MShigh |
|
|---|
| LysN MShigh |
|
|---|
| TryLysC MShigh |
|
|---|
General Statistics
Number of major isoforms |
Number of additional isoforms |
Number of all proteins |
Number of amino acids |
Min. Seq. Length |
Max. Seq. Length |
Avg. Seq. Length |
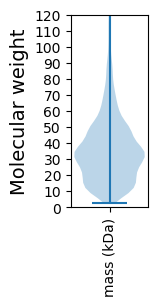
Avg. Mol. Weight |
|---|---|---|---|---|---|---|---|
0 |
2694558 |
19 |
3154 |
343.3 |
38.16 |
Amino acid frequency
Ala |
Cys |
Asp |
Glu |
Phe |
Gly |
His |
Ile |
Lys |
Leu |
|---|---|---|---|---|---|---|---|---|---|
8.8 ± 0.033 | 0.828 ± 0.01 |
5.367 ± 0.017 | 6.495 ± 0.032 |
4.07 ± 0.018 | 7.869 ± 0.027 |
2.104 ± 0.015 | 6.02 ± 0.021 |
5.04 ± 0.025 | 9.698 ± 0.032 |
Met |
Asn |
Gln |
Pro |
Arg |
Ser |
Thr |
Val |
Trp |
Tyr |
|---|---|---|---|---|---|---|---|---|---|
2.724 ± 0.013 | 3.646 ± 0.022 |
4.403 ± 0.018 | 3.507 ± 0.016 |
5.827 ± 0.03 | 6.244 ± 0.02 |
5.404 ± 0.028 | 7.044 ± 0.023 |
1.343 ± 0.011 | 3.566 ± 0.02 |
Most of the basic statistics you can see at this page can be downloaded from this CSV file
See this proteome in:

Proteome-pI is available under Creative Commons Attribution-NoDerivs license, for more details see here
| Reference: Kozlowski LP. Proteome-pI 2.0: Proteome Isoelectric Point Database Update. Nucleic Acids Res. 2021, doi: 10.1093/nar/gkab944 | Contact: Lukasz P. Kozlowski |