Microbacterium phage PhriedRice
Taxonomy: Viruses; Duplodnaviria; Heunggongvirae; Uroviricota; Caudoviricetes; Caudovirales; Podoviridae; Eekayvirinae; Akonivirus; unclassified Akonivirus
Average proteome isoelectric point is 5.84
Get precalculated fractions of proteins
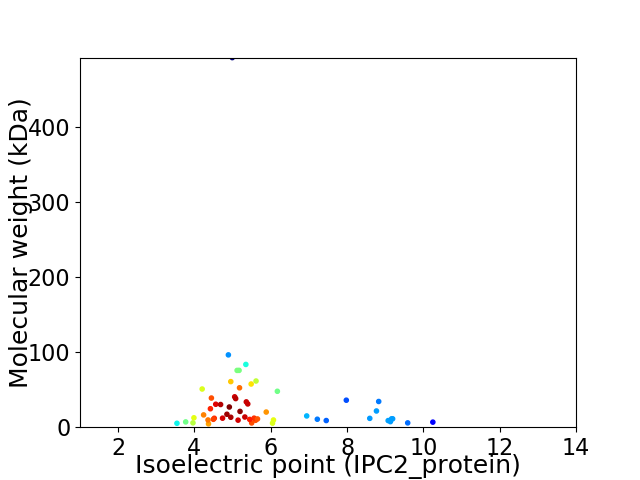
Virtual 2D-PAGE plot for 56 proteins (isoelectric point calculated using IPC2_protein)
Get csv file with sequences according to given criteria:
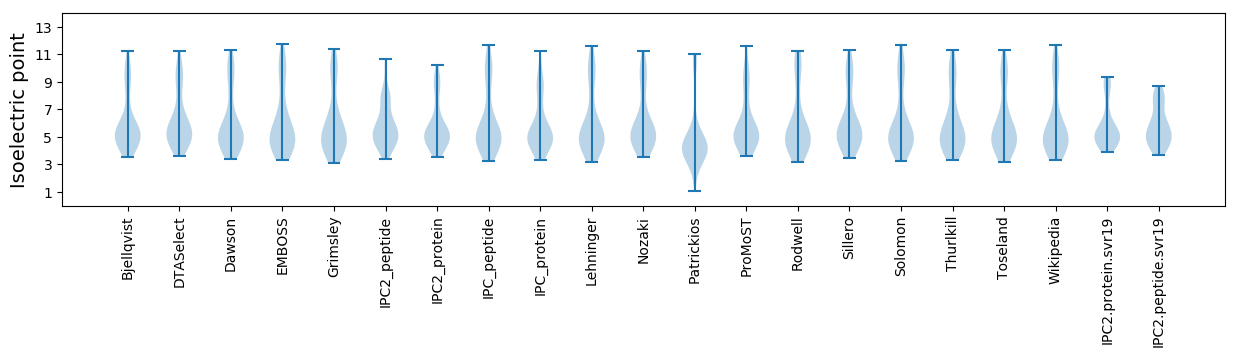
* You can choose from 21 different methods for calculating isoelectric point
Summary statistics related to proteome-wise predictions
Protein with the lowest isoelectric point:
>tr|A0A5J6T5C0|A0A5J6T5C0_9CAUD DNA primase OS=Microbacterium phage PhriedRice OX=2652407 GN=3 PE=4 SV=1
MM1 pKa = 8.12AYY3 pKa = 10.2RR4 pKa = 11.84IVTEE8 pKa = 4.09VEE10 pKa = 4.01VAEE13 pKa = 4.49GTDD16 pKa = 3.34AVGISSVLSYY26 pKa = 11.31VLNTSLQGVPGVTSVSITEE45 pKa = 3.87LTAIEE50 pKa = 4.47EE51 pKa = 4.75GNNNAA56 pKa = 4.87
MM1 pKa = 8.12AYY3 pKa = 10.2RR4 pKa = 11.84IVTEE8 pKa = 4.09VEE10 pKa = 4.01VAEE13 pKa = 4.49GTDD16 pKa = 3.34AVGISSVLSYY26 pKa = 11.31VLNTSLQGVPGVTSVSITEE45 pKa = 3.87LTAIEE50 pKa = 4.47EE51 pKa = 4.75GNNNAA56 pKa = 4.87
Molecular weight: 5.77 kDa
Isoelectric point according different methods:
Protein with the highest isoelectric point:
>tr|A0A5J6T5B8|A0A5J6T5B8_9CAUD Uncharacterized protein OS=Microbacterium phage PhriedRice OX=2652407 GN=39 PE=4 SV=1
MM1 pKa = 7.34MEE3 pKa = 4.26PLIFLGLLIVVGLTIVAIADD23 pKa = 3.16IVKK26 pKa = 9.84YY27 pKa = 7.52EE28 pKa = 3.59RR29 pKa = 11.84RR30 pKa = 11.84MRR32 pKa = 11.84RR33 pKa = 11.84VNNTINSLEE42 pKa = 4.17RR43 pKa = 11.84GRR45 pKa = 11.84GRR47 pKa = 11.84HH48 pKa = 5.58SEE50 pKa = 3.85
MM1 pKa = 7.34MEE3 pKa = 4.26PLIFLGLLIVVGLTIVAIADD23 pKa = 3.16IVKK26 pKa = 9.84YY27 pKa = 7.52EE28 pKa = 3.59RR29 pKa = 11.84RR30 pKa = 11.84MRR32 pKa = 11.84RR33 pKa = 11.84VNNTINSLEE42 pKa = 4.17RR43 pKa = 11.84GRR45 pKa = 11.84GRR47 pKa = 11.84HH48 pKa = 5.58SEE50 pKa = 3.85
Molecular weight: 5.75 kDa
Isoelectric point according different methods:
Peptides (in silico digests for buttom-up proteomics)
Below you can find in silico digests of the whole proteome with Trypsin, Chymotrypsin, Trypsin+LysC, LysN, ArgC proteases suitable for different mass spec machines.| Try ESI |
 |
|---|
| ChTry ESI |
|
|---|
| ArgC ESI |
|
|---|
| LysN ESI |
|
|---|
| TryLysC ESI |
|
|---|
| Try MALDI |
|
|---|
| ChTry MALDI |
|
|---|
| ArgC MALDI |
|
|---|
| LysN MALDI |
|
|---|
| TryLysC MALDI |
|
|---|
| Try LTQ |
|
|---|
| ChTry LTQ |
|
|---|
| ArgC LTQ |
|
|---|
| LysN LTQ |
|
|---|
| TryLysC LTQ |
|
|---|
| Try MSlow |
|
|---|
| ChTry MSlow |
|
|---|
| ArgC MSlow |
|
|---|
| LysN MSlow |
|
|---|
| TryLysC MSlow |
|
|---|
| Try MShigh |
|
|---|
| ChTry MShigh |
|
|---|
| ArgC MShigh |
|
|---|
| LysN MShigh |
|
|---|
| TryLysC MShigh |
|
|---|
General Statistics
Number of major isoforms |
Number of additional isoforms |
Number of all proteins |
Number of amino acids |
Min. Seq. Length |
Max. Seq. Length |
Avg. Seq. Length |
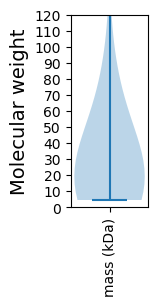
Avg. Mol. Weight |
|---|---|---|---|---|---|---|---|
0 |
17049 |
38 |
4489 |
304.4 |
33.76 |
Amino acid frequency
Ala |
Cys |
Asp |
Glu |
Phe |
Gly |
His |
Ile |
Lys |
Leu |
|---|---|---|---|---|---|---|---|---|---|
9.525 ± 0.396 | 0.463 ± 0.145 |
6.634 ± 0.211 | 6.622 ± 0.375 |
3.232 ± 0.115 | 7.484 ± 0.325 |
1.666 ± 0.164 | 4.962 ± 0.173 |
4.364 ± 0.379 | 8.288 ± 0.246 |
Met |
Asn |
Gln |
Pro |
Arg |
Ser |
Thr |
Val |
Trp |
Tyr |
|---|---|---|---|---|---|---|---|---|---|
2.528 ± 0.123 | 4.663 ± 0.193 |
4.552 ± 0.205 | 4.557 ± 0.307 |
5.953 ± 0.336 | 6.188 ± 0.285 |
6.827 ± 0.277 | 6.522 ± 0.255 |
1.842 ± 0.11 | 3.126 ± 0.227 |
Most of the basic statistics you can see at this page can be downloaded from this CSV file
See this proteome in:

Proteome-pI is available under Creative Commons Attribution-NoDerivs license, for more details see here
| Reference: Kozlowski LP. Proteome-pI 2.0: Proteome Isoelectric Point Database Update. Nucleic Acids Res. 2021, doi: 10.1093/nar/gkab944 | Contact: Lukasz P. Kozlowski |