Salmonella phage SEN22
Taxonomy: Viruses; Duplodnaviria; Heunggongvirae; Uroviricota; Caudoviricetes; Caudovirales; Podoviridae; Lederbergvirus; unclassified Lederbergvirus
Average proteome isoelectric point is 6.79
Get precalculated fractions of proteins
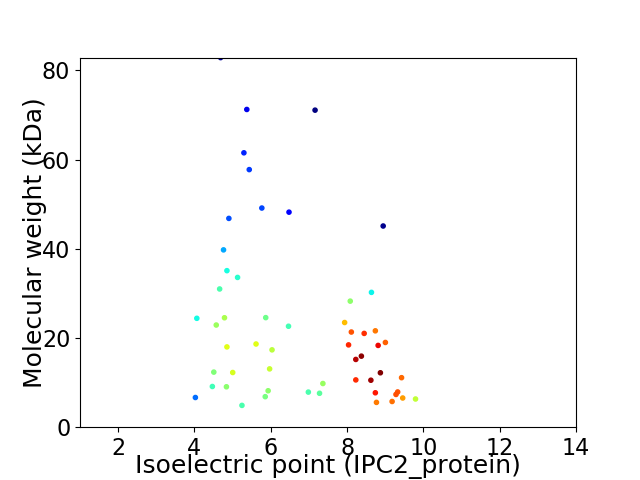
Virtual 2D-PAGE plot for 55 proteins (isoelectric point calculated using IPC2_protein)
Get csv file with sequences according to given criteria:
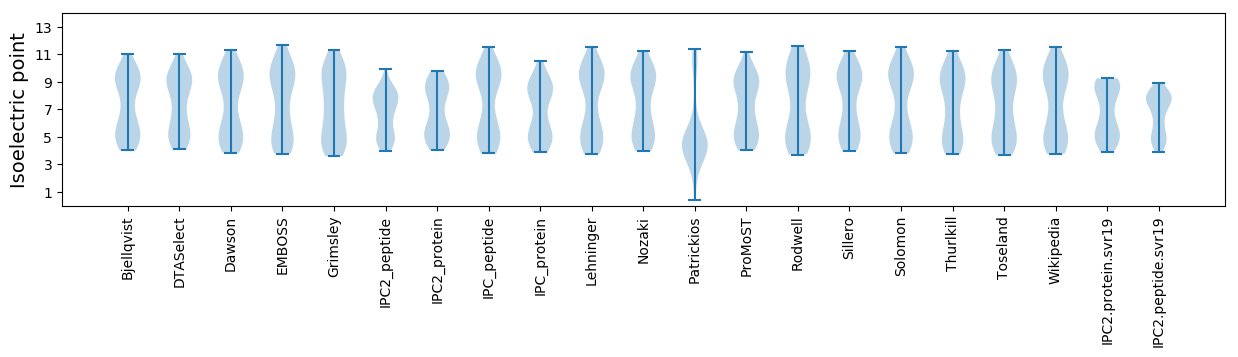
* You can choose from 21 different methods for calculating isoelectric point
Summary statistics related to proteome-wise predictions
Protein with the lowest isoelectric point:
>tr|A0A0M5M1J2|A0A0M5M1J2_9CAUD Regulatory protein OS=Salmonella phage SEN22 OX=1647458 GN=SEN22_18 PE=4 SV=1
MM1 pKa = 7.82IDD3 pKa = 3.4PNRR6 pKa = 11.84SYY8 pKa = 10.45EE9 pKa = 3.92QEE11 pKa = 3.88SIARR15 pKa = 11.84VMCAGCNKK23 pKa = 9.43QLAPDD28 pKa = 4.66EE29 pKa = 4.79IYY31 pKa = 11.13ACAEE35 pKa = 4.36CVNEE39 pKa = 3.7WLVYY43 pKa = 10.08RR44 pKa = 11.84DD45 pKa = 3.97PNGDD49 pKa = 3.31MSNEE53 pKa = 4.49DD54 pKa = 3.13IQEE57 pKa = 3.88QQ58 pKa = 3.5
MM1 pKa = 7.82IDD3 pKa = 3.4PNRR6 pKa = 11.84SYY8 pKa = 10.45EE9 pKa = 3.92QEE11 pKa = 3.88SIARR15 pKa = 11.84VMCAGCNKK23 pKa = 9.43QLAPDD28 pKa = 4.66EE29 pKa = 4.79IYY31 pKa = 11.13ACAEE35 pKa = 4.36CVNEE39 pKa = 3.7WLVYY43 pKa = 10.08RR44 pKa = 11.84DD45 pKa = 3.97PNGDD49 pKa = 3.31MSNEE53 pKa = 4.49DD54 pKa = 3.13IQEE57 pKa = 3.88QQ58 pKa = 3.5
Molecular weight: 6.66 kDa
Isoelectric point according different methods:
Protein with the highest isoelectric point:
>tr|A0A0M4S6T3|A0A0M4S6T3_9CAUD NinF protein OS=Salmonella phage SEN22 OX=1647458 GN=SEN22_47 PE=4 SV=1
MM1 pKa = 6.72QQFAIAGAASVRR13 pKa = 11.84PFNPILSVQHH23 pKa = 5.3SRR25 pKa = 11.84KK26 pKa = 10.2NILTGADD33 pKa = 3.88FKK35 pKa = 10.97QPRR38 pKa = 11.84MKK40 pKa = 10.71SFLEE44 pKa = 3.89KK45 pKa = 10.82LLDD48 pKa = 3.44ILKK51 pKa = 9.5QQGRR55 pKa = 11.84PP56 pKa = 3.38
MM1 pKa = 6.72QQFAIAGAASVRR13 pKa = 11.84PFNPILSVQHH23 pKa = 5.3SRR25 pKa = 11.84KK26 pKa = 10.2NILTGADD33 pKa = 3.88FKK35 pKa = 10.97QPRR38 pKa = 11.84MKK40 pKa = 10.71SFLEE44 pKa = 3.89KK45 pKa = 10.82LLDD48 pKa = 3.44ILKK51 pKa = 9.5QQGRR55 pKa = 11.84PP56 pKa = 3.38
Molecular weight: 6.32 kDa
Isoelectric point according different methods:
Peptides (in silico digests for buttom-up proteomics)
Below you can find in silico digests of the whole proteome with Trypsin, Chymotrypsin, Trypsin+LysC, LysN, ArgC proteases suitable for different mass spec machines.| Try ESI |
 |
|---|
| ChTry ESI |
|
|---|
| ArgC ESI |
|
|---|
| LysN ESI |
|
|---|
| TryLysC ESI |
|
|---|
| Try MALDI |
|
|---|
| ChTry MALDI |
|
|---|
| ArgC MALDI |
|
|---|
| LysN MALDI |
|
|---|
| TryLysC MALDI |
|
|---|
| Try LTQ |
|
|---|
| ChTry LTQ |
|
|---|
| ArgC LTQ |
|
|---|
| LysN LTQ |
|
|---|
| TryLysC LTQ |
|
|---|
| Try MSlow |
|
|---|
| ChTry MSlow |
|
|---|
| ArgC MSlow |
|
|---|
| LysN MSlow |
|
|---|
| TryLysC MSlow |
|
|---|
| Try MShigh |
|
|---|
| ChTry MShigh |
|
|---|
| ArgC MShigh |
|
|---|
| LysN MShigh |
|
|---|
| TryLysC MShigh |
|
|---|
General Statistics
Number of major isoforms |
Number of additional isoforms |
Number of all proteins |
Number of amino acids |
Min. Seq. Length |
Max. Seq. Length |
Avg. Seq. Length |
Avg. Mol. Weight |
|---|---|---|---|---|---|---|---|
0 |
11457 |
46 |
725 |
208.3 |
23.24 |
Amino acid frequency
Ala |
Cys |
Asp |
Glu |
Phe |
Gly |
His |
Ile |
Lys |
Leu |
|---|---|---|---|---|---|---|---|---|---|
9.331 ± 0.74 | 1.37 ± 0.16 |
6.119 ± 0.286 | 6.86 ± 0.421 |
3.247 ± 0.204 | 7.288 ± 0.526 |
1.693 ± 0.177 | 6.18 ± 0.271 |
6.101 ± 0.34 | 7.393 ± 0.291 |
Met |
Asn |
Gln |
Pro |
Arg |
Ser |
Thr |
Val |
Trp |
Tyr |
|---|---|---|---|---|---|---|---|---|---|
2.741 ± 0.142 | 4.888 ± 0.323 |
3.762 ± 0.213 | 4.556 ± 0.364 |
5.961 ± 0.304 | 6.284 ± 0.312 |
5.499 ± 0.41 | 5.909 ± 0.301 |
1.562 ± 0.14 | 3.256 ± 0.265 |
Most of the basic statistics you can see at this page can be downloaded from this CSV file
See this proteome in:

Proteome-pI is available under Creative Commons Attribution-NoDerivs license, for more details see here
| Reference: Kozlowski LP. Proteome-pI 2.0: Proteome Isoelectric Point Database Update. Nucleic Acids Res. 2021, doi: 10.1093/nar/gkab944 | Contact: Lukasz P. Kozlowski |