Eubacterium sp. CAG:38
Taxonomy: cellular organisms; Bacteria; Terrabacteria group; Firmicutes; Clostridia; Eubacteriales; Eubacteriaceae; Eubacterium; environmental samples
Average proteome isoelectric point is 5.98
Get precalculated fractions of proteins
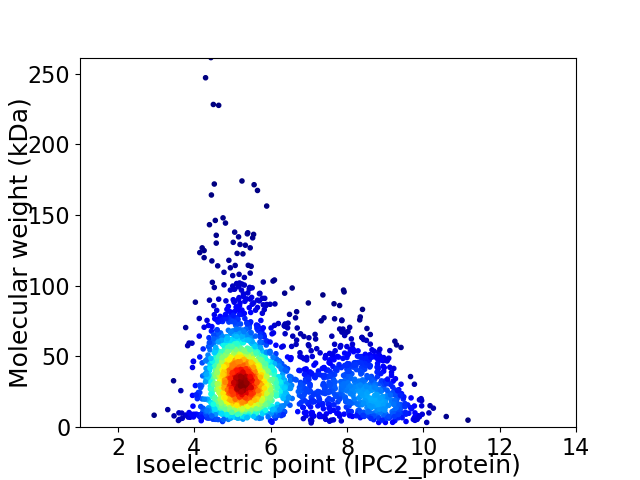
Virtual 2D-PAGE plot for 2436 proteins (isoelectric point calculated using IPC2_protein)
Get csv file with sequences according to given criteria:
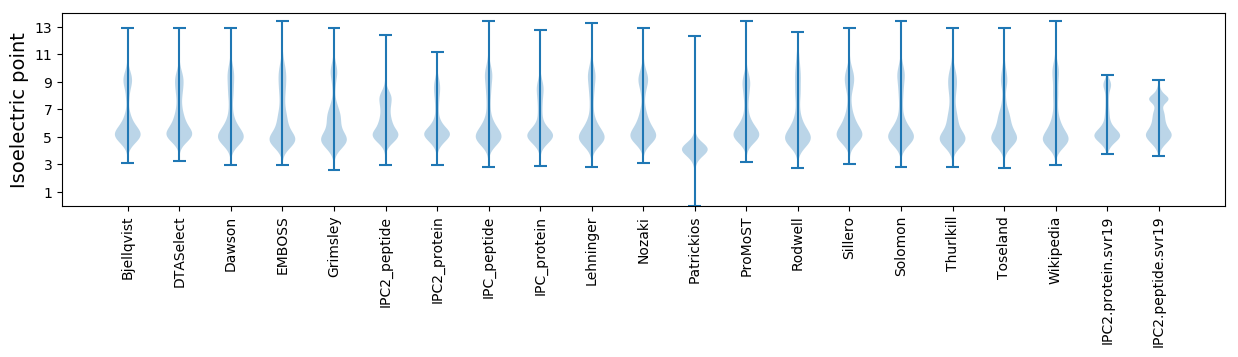
* You can choose from 21 different methods for calculating isoelectric point
Summary statistics related to proteome-wise predictions
Protein with the lowest isoelectric point:
>tr|R7HBY2|R7HBY2_9FIRM Uncharacterized protein OS=Eubacterium sp. CAG:38 OX=1262889 GN=BN634_00225 PE=4 SV=1
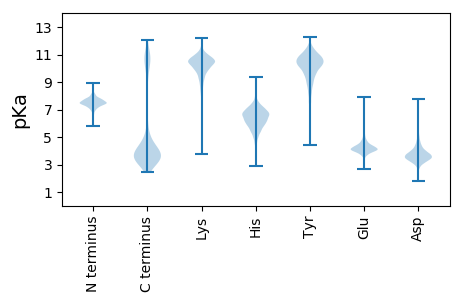
MM1 pKa = 7.56RR2 pKa = 11.84LIYY5 pKa = 10.25SDD7 pKa = 5.13YY8 pKa = 11.11NPQTNSIDD16 pKa = 2.81ITTFEE21 pKa = 4.2NYY23 pKa = 9.44ILRR26 pKa = 11.84IDD28 pKa = 3.94CNKK31 pKa = 9.77VEE33 pKa = 5.05DD34 pKa = 4.32GLRR37 pKa = 11.84TTPCSQNSLNALAIDD52 pKa = 4.18EE53 pKa = 4.41PLEE56 pKa = 4.03YY57 pKa = 10.67ARR59 pKa = 11.84LALDD63 pKa = 3.99GEE65 pKa = 4.4MQAWVDD71 pKa = 4.36AIDD74 pKa = 4.47SLEE77 pKa = 3.86VWW79 pKa = 3.62
MM1 pKa = 7.56RR2 pKa = 11.84LIYY5 pKa = 10.25SDD7 pKa = 5.13YY8 pKa = 11.11NPQTNSIDD16 pKa = 2.81ITTFEE21 pKa = 4.2NYY23 pKa = 9.44ILRR26 pKa = 11.84IDD28 pKa = 3.94CNKK31 pKa = 9.77VEE33 pKa = 5.05DD34 pKa = 4.32GLRR37 pKa = 11.84TTPCSQNSLNALAIDD52 pKa = 4.18EE53 pKa = 4.41PLEE56 pKa = 4.03YY57 pKa = 10.67ARR59 pKa = 11.84LALDD63 pKa = 3.99GEE65 pKa = 4.4MQAWVDD71 pKa = 4.36AIDD74 pKa = 4.47SLEE77 pKa = 3.86VWW79 pKa = 3.62
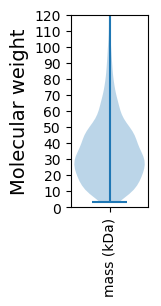
Molecular weight: 9.06 kDa
Isoelectric point according different methods:
Protein with the highest isoelectric point:
>tr|R7HCK8|R7HCK8_9FIRM Fe2+/Zn2+ uptake regulation protein OS=Eubacterium sp. CAG:38 OX=1262889 GN=BN634_00437 PE=3 SV=1
MM1 pKa = 7.67KK2 pKa = 8.71MTFQPKK8 pKa = 7.43TRR10 pKa = 11.84QRR12 pKa = 11.84AKK14 pKa = 9.26VHH16 pKa = 5.59GFRR19 pKa = 11.84ARR21 pKa = 11.84MSSAGGRR28 pKa = 11.84KK29 pKa = 8.81VLAARR34 pKa = 11.84RR35 pKa = 11.84AKK37 pKa = 9.92GRR39 pKa = 11.84KK40 pKa = 8.91RR41 pKa = 11.84LSAA44 pKa = 3.96
MM1 pKa = 7.67KK2 pKa = 8.71MTFQPKK8 pKa = 7.43TRR10 pKa = 11.84QRR12 pKa = 11.84AKK14 pKa = 9.26VHH16 pKa = 5.59GFRR19 pKa = 11.84ARR21 pKa = 11.84MSSAGGRR28 pKa = 11.84KK29 pKa = 8.81VLAARR34 pKa = 11.84RR35 pKa = 11.84AKK37 pKa = 9.92GRR39 pKa = 11.84KK40 pKa = 8.91RR41 pKa = 11.84LSAA44 pKa = 3.96
Molecular weight: 4.98 kDa
Isoelectric point according different methods:
Peptides (in silico digests for buttom-up proteomics)
Below you can find in silico digests of the whole proteome with Trypsin, Chymotrypsin, Trypsin+LysC, LysN, ArgC proteases suitable for different mass spec machines.| Try ESI |
 |
|---|
| ChTry ESI |
|
|---|
| ArgC ESI |
|
|---|
| LysN ESI |
|
|---|
| TryLysC ESI |
|
|---|
| Try MALDI |
|
|---|
| ChTry MALDI |
|
|---|
| ArgC MALDI |
|
|---|
| LysN MALDI |
|
|---|
| TryLysC MALDI |
|
|---|
| Try LTQ |
|
|---|
| ChTry LTQ |
|
|---|
| ArgC LTQ |
|
|---|
| LysN LTQ |
|
|---|
| TryLysC LTQ |
|
|---|
| Try MSlow |
|
|---|
| ChTry MSlow |
|
|---|
| ArgC MSlow |
|
|---|
| LysN MSlow |
|
|---|
| TryLysC MSlow |
|
|---|
| Try MShigh |
|
|---|
| ChTry MShigh |
|
|---|
| ArgC MShigh |
|
|---|
| LysN MShigh |
|
|---|
| TryLysC MShigh |
|
|---|
General Statistics
Number of major isoforms |
Number of additional isoforms |
Number of all proteins |
Number of amino acids |
Min. Seq. Length |
Max. Seq. Length |
Avg. Seq. Length |
Avg. Mol. Weight |
|---|---|---|---|---|---|---|---|
0 |
802892 |
29 |
2399 |
329.6 |
36.86 |
Amino acid frequency
Ala |
Cys |
Asp |
Glu |
Phe |
Gly |
His |
Ile |
Lys |
Leu |
|---|---|---|---|---|---|---|---|---|---|
7.957 ± 0.058 | 1.498 ± 0.024 |
5.667 ± 0.039 | 7.333 ± 0.051 |
3.982 ± 0.038 | 6.854 ± 0.049 |
1.703 ± 0.023 | 7.394 ± 0.054 |
7.023 ± 0.043 | 8.521 ± 0.051 |
Met |
Asn |
Gln |
Pro |
Arg |
Ser |
Thr |
Val |
Trp |
Tyr |
|---|---|---|---|---|---|---|---|---|---|
3.096 ± 0.029 | 4.641 ± 0.033 |
2.974 ± 0.028 | 3.54 ± 0.033 |
3.928 ± 0.033 | 5.755 ± 0.048 |
5.82 ± 0.053 | 7.205 ± 0.042 |
0.772 ± 0.017 | 4.334 ± 0.036 |
Most of the basic statistics you can see at this page can be downloaded from this CSV file
See this proteome in:

Proteome-pI is available under Creative Commons Attribution-NoDerivs license, for more details see here
| Reference: Kozlowski LP. Proteome-pI 2.0: Proteome Isoelectric Point Database Update. Nucleic Acids Res. 2021, doi: 10.1093/nar/gkab944 | Contact: Lukasz P. Kozlowski |