Enterococcus phage vB_EfaS-DELF1
Taxonomy: Viruses; Duplodnaviria; Heunggongvirae; Uroviricota; Caudoviricetes; Caudovirales; Siphoviridae; unclassified Siphoviridae
Average proteome isoelectric point is 6.27
Get precalculated fractions of proteins
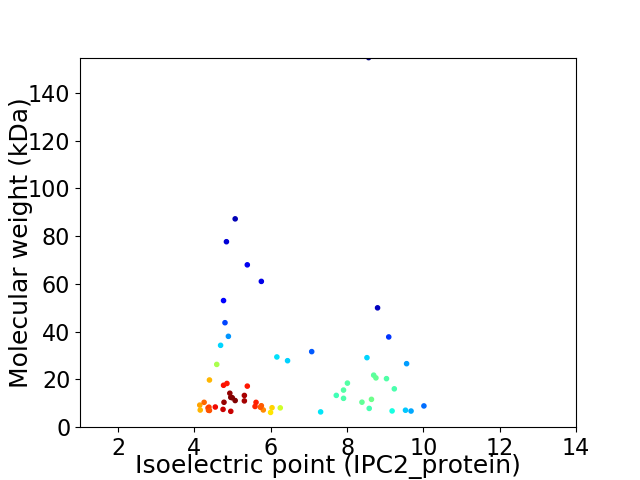
Virtual 2D-PAGE plot for 62 proteins (isoelectric point calculated using IPC2_protein)
Get csv file with sequences according to given criteria:
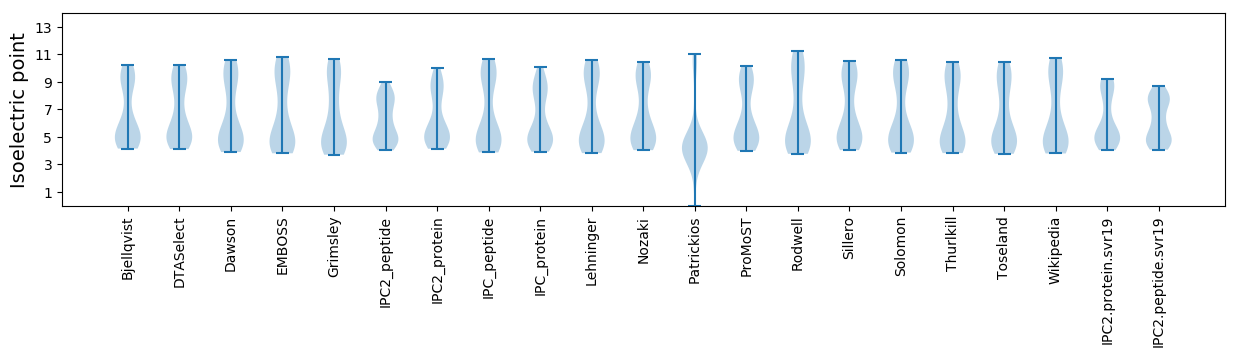
* You can choose from 21 different methods for calculating isoelectric point
Summary statistics related to proteome-wise predictions
Protein with the lowest isoelectric point:
>tr|A0A5S9MQ42|A0A5S9MQ42_9CAUD Uncharacterized protein OS=Enterococcus phage vB_EfaS-DELF1 OX=2683673 PE=4 SV=1
MM1 pKa = 7.02MKK3 pKa = 9.97IVVTNYY9 pKa = 10.37NGGEE13 pKa = 4.42GIQVMEE19 pKa = 4.03YY20 pKa = 11.01NYY22 pKa = 8.45ITKK25 pKa = 10.03YY26 pKa = 9.59WFSNDD31 pKa = 3.41YY32 pKa = 10.96LILEE36 pKa = 4.81DD37 pKa = 4.52NVNQIKK43 pKa = 9.28TYY45 pKa = 9.53IQNDD49 pKa = 3.29QVLEE53 pKa = 4.06FEE55 pKa = 4.98VYY57 pKa = 10.42YY58 pKa = 10.53EE59 pKa = 4.0
MM1 pKa = 7.02MKK3 pKa = 9.97IVVTNYY9 pKa = 10.37NGGEE13 pKa = 4.42GIQVMEE19 pKa = 4.03YY20 pKa = 11.01NYY22 pKa = 8.45ITKK25 pKa = 10.03YY26 pKa = 9.59WFSNDD31 pKa = 3.41YY32 pKa = 10.96LILEE36 pKa = 4.81DD37 pKa = 4.52NVNQIKK43 pKa = 9.28TYY45 pKa = 9.53IQNDD49 pKa = 3.29QVLEE53 pKa = 4.06FEE55 pKa = 4.98VYY57 pKa = 10.42YY58 pKa = 10.53EE59 pKa = 4.0
Molecular weight: 7.19 kDa
Isoelectric point according different methods:
Protein with the highest isoelectric point:
>tr|A0A5S9MR39|A0A5S9MR39_9CAUD Uncharacterized protein OS=Enterococcus phage vB_EfaS-DELF1 OX=2683673 PE=4 SV=1
MM1 pKa = 7.49NYY3 pKa = 9.88IKK5 pKa = 10.97GIMNAIKK12 pKa = 9.48MNRR15 pKa = 11.84VVLYY19 pKa = 10.5KK20 pKa = 10.42LIPSLLLVFSLSYY33 pKa = 10.59LPHH36 pKa = 6.09TVLVYY41 pKa = 10.12IIRR44 pKa = 11.84VTTVGFALMSCGTLIYY60 pKa = 10.42IGVNDD65 pKa = 5.33AKK67 pKa = 10.89FKK69 pKa = 10.28NNKK72 pKa = 8.65KK73 pKa = 10.19KK74 pKa = 10.69RR75 pKa = 11.84INKK78 pKa = 9.07
MM1 pKa = 7.49NYY3 pKa = 9.88IKK5 pKa = 10.97GIMNAIKK12 pKa = 9.48MNRR15 pKa = 11.84VVLYY19 pKa = 10.5KK20 pKa = 10.42LIPSLLLVFSLSYY33 pKa = 10.59LPHH36 pKa = 6.09TVLVYY41 pKa = 10.12IIRR44 pKa = 11.84VTTVGFALMSCGTLIYY60 pKa = 10.42IGVNDD65 pKa = 5.33AKK67 pKa = 10.89FKK69 pKa = 10.28NNKK72 pKa = 8.65KK73 pKa = 10.19KK74 pKa = 10.69RR75 pKa = 11.84INKK78 pKa = 9.07
Molecular weight: 8.91 kDa
Isoelectric point according different methods:
Peptides (in silico digests for buttom-up proteomics)
Below you can find in silico digests of the whole proteome with Trypsin, Chymotrypsin, Trypsin+LysC, LysN, ArgC proteases suitable for different mass spec machines.| Try ESI |
 |
|---|
| ChTry ESI |
|
|---|
| ArgC ESI |
|
|---|
| LysN ESI |
|
|---|
| TryLysC ESI |
|
|---|
| Try MALDI |
|
|---|
| ChTry MALDI |
|
|---|
| ArgC MALDI |
|
|---|
| LysN MALDI |
|
|---|
| TryLysC MALDI |
|
|---|
| Try LTQ |
|
|---|
| ChTry LTQ |
|
|---|
| ArgC LTQ |
|
|---|
| LysN LTQ |
|
|---|
| TryLysC LTQ |
|
|---|
| Try MSlow |
|
|---|
| ChTry MSlow |
|
|---|
| ArgC MSlow |
|
|---|
| LysN MSlow |
|
|---|
| TryLysC MSlow |
|
|---|
| Try MShigh |
|
|---|
| ChTry MShigh |
|
|---|
| ArgC MShigh |
|
|---|
| LysN MShigh |
|
|---|
| TryLysC MShigh |
|
|---|
General Statistics
Number of major isoforms |
Number of additional isoforms |
Number of all proteins |
Number of amino acids |
Min. Seq. Length |
Max. Seq. Length |
Avg. Seq. Length |
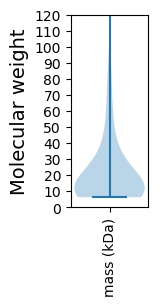
Avg. Mol. Weight |
|---|---|---|---|---|---|---|---|
0 |
12168 |
55 |
1441 |
196.3 |
22.34 |
Amino acid frequency
Ala |
Cys |
Asp |
Glu |
Phe |
Gly |
His |
Ile |
Lys |
Leu |
|---|---|---|---|---|---|---|---|---|---|
5.556 ± 0.478 | 0.575 ± 0.108 |
6.024 ± 0.285 | 7.52 ± 0.439 |
4.076 ± 0.224 | 6.542 ± 0.528 |
1.479 ± 0.159 | 6.616 ± 0.227 |
8.843 ± 0.372 | 8.695 ± 0.288 |
Met |
Asn |
Gln |
Pro |
Arg |
Ser |
Thr |
Val |
Trp |
Tyr |
|---|---|---|---|---|---|---|---|---|---|
2.622 ± 0.12 | 6.977 ± 0.32 |
2.901 ± 0.188 | 3.567 ± 0.189 |
3.838 ± 0.217 | 5.531 ± 0.286 |
6.402 ± 0.347 | 6.55 ± 0.239 |
1.233 ± 0.098 | 4.454 ± 0.283 |
Most of the basic statistics you can see at this page can be downloaded from this CSV file
See this proteome in:

Proteome-pI is available under Creative Commons Attribution-NoDerivs license, for more details see here
| Reference: Kozlowski LP. Proteome-pI 2.0: Proteome Isoelectric Point Database Update. Nucleic Acids Res. 2021, doi: 10.1093/nar/gkab944 | Contact: Lukasz P. Kozlowski |