Clostridium sp. CAG:762
Taxonomy: cellular organisms; Bacteria; Terrabacteria group; Firmicutes; Clostridia; Eubacteriales; Clostridiaceae; Clostridium; environmental samples
Average proteome isoelectric point is 6.88
Get precalculated fractions of proteins
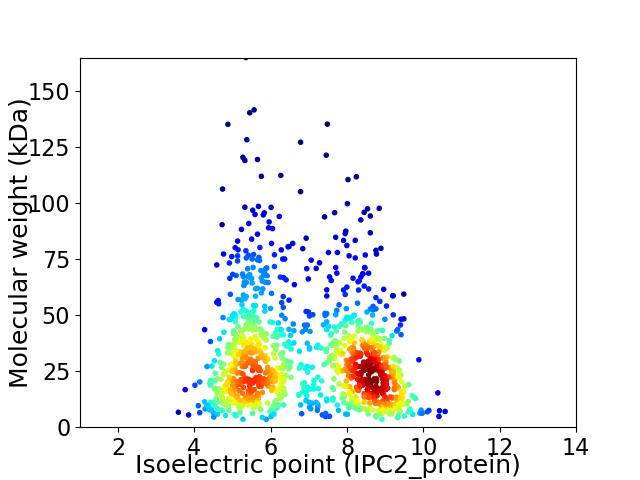
Virtual 2D-PAGE plot for 1127 proteins (isoelectric point calculated using IPC2_protein)
Get csv file with sequences according to given criteria:
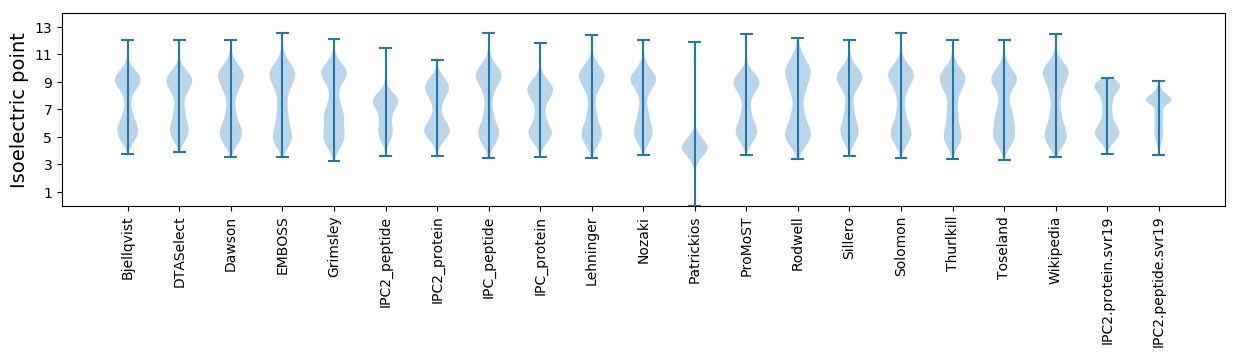
* You can choose from 21 different methods for calculating isoelectric point
Summary statistics related to proteome-wise predictions
Protein with the lowest isoelectric point:
>tr|R5ST25|R5ST25_9CLOT Cell shape-determining protein MreB OS=Clostridium sp. CAG:762 OX=1262837 GN=mreB PE=3 SV=1
MM1 pKa = 7.4IRR3 pKa = 11.84TEE5 pKa = 3.99TDD7 pKa = 2.59EE8 pKa = 6.07DD9 pKa = 3.73ITDD12 pKa = 3.45EE13 pKa = 4.4EE14 pKa = 4.84YY15 pKa = 10.63IKK17 pKa = 10.72VLKK20 pKa = 10.52PFVDD24 pKa = 4.11NYY26 pKa = 11.53DD27 pKa = 3.94EE28 pKa = 4.32YY29 pKa = 11.63LEE31 pKa = 5.31SYY33 pKa = 9.91VLPEE37 pKa = 5.37LISNYY42 pKa = 9.23IANAA46 pKa = 3.62
MM1 pKa = 7.4IRR3 pKa = 11.84TEE5 pKa = 3.99TDD7 pKa = 2.59EE8 pKa = 6.07DD9 pKa = 3.73ITDD12 pKa = 3.45EE13 pKa = 4.4EE14 pKa = 4.84YY15 pKa = 10.63IKK17 pKa = 10.72VLKK20 pKa = 10.52PFVDD24 pKa = 4.11NYY26 pKa = 11.53DD27 pKa = 3.94EE28 pKa = 4.32YY29 pKa = 11.63LEE31 pKa = 5.31SYY33 pKa = 9.91VLPEE37 pKa = 5.37LISNYY42 pKa = 9.23IANAA46 pKa = 3.62
Molecular weight: 5.48 kDa
Isoelectric point according different methods:
Protein with the highest isoelectric point:
>tr|R5TDS3|R5TDS3_9CLOT Uncharacterized conserved protein OS=Clostridium sp. CAG:762 OX=1262837 GN=BN775_00625 PE=4 SV=1
MM1 pKa = 7.9RR2 pKa = 11.84KK3 pKa = 9.55LNKK6 pKa = 10.02NEE8 pKa = 4.74LININGGFKK17 pKa = 10.22ISGAILQYY25 pKa = 11.07GRR27 pKa = 11.84LFVLAFYY34 pKa = 10.51DD35 pKa = 3.11IGVGVGSAIRR45 pKa = 11.84RR46 pKa = 11.84FSKK49 pKa = 10.62RR50 pKa = 11.84NYY52 pKa = 10.16CPINN56 pKa = 3.4
MM1 pKa = 7.9RR2 pKa = 11.84KK3 pKa = 9.55LNKK6 pKa = 10.02NEE8 pKa = 4.74LININGGFKK17 pKa = 10.22ISGAILQYY25 pKa = 11.07GRR27 pKa = 11.84LFVLAFYY34 pKa = 10.51DD35 pKa = 3.11IGVGVGSAIRR45 pKa = 11.84RR46 pKa = 11.84FSKK49 pKa = 10.62RR50 pKa = 11.84NYY52 pKa = 10.16CPINN56 pKa = 3.4
Molecular weight: 6.31 kDa
Isoelectric point according different methods:
Peptides (in silico digests for buttom-up proteomics)
Below you can find in silico digests of the whole proteome with Trypsin, Chymotrypsin, Trypsin+LysC, LysN, ArgC proteases suitable for different mass spec machines.| Try ESI |
 |
|---|
| ChTry ESI |
|
|---|
| ArgC ESI |
|
|---|
| LysN ESI |
|
|---|
| TryLysC ESI |
|
|---|
| Try MALDI |
|
|---|
| ChTry MALDI |
|
|---|
| ArgC MALDI |
|
|---|
| LysN MALDI |
|
|---|
| TryLysC MALDI |
|
|---|
| Try LTQ |
|
|---|
| ChTry LTQ |
|
|---|
| ArgC LTQ |
|
|---|
| LysN LTQ |
|
|---|
| TryLysC LTQ |
|
|---|
| Try MSlow |
|
|---|
| ChTry MSlow |
|
|---|
| ArgC MSlow |
|
|---|
| LysN MSlow |
|
|---|
| TryLysC MSlow |
|
|---|
| Try MShigh |
|
|---|
| ChTry MShigh |
|
|---|
| ArgC MShigh |
|
|---|
| LysN MShigh |
|
|---|
| TryLysC MShigh |
|
|---|
General Statistics
Number of major isoforms |
Number of additional isoforms |
Number of all proteins |
Number of amino acids |
Min. Seq. Length |
Max. Seq. Length |
Avg. Seq. Length |
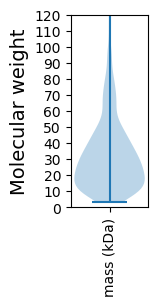
Avg. Mol. Weight |
|---|---|---|---|---|---|---|---|
0 |
327007 |
30 |
1441 |
290.2 |
33.29 |
Amino acid frequency
Ala |
Cys |
Asp |
Glu |
Phe |
Gly |
His |
Ile |
Lys |
Leu |
|---|---|---|---|---|---|---|---|---|---|
4.02 ± 0.059 | 1.043 ± 0.029 |
5.945 ± 0.054 | 6.881 ± 0.075 |
4.075 ± 0.059 | 5.215 ± 0.069 |
1.324 ± 0.027 | 10.738 ± 0.097 |
10.183 ± 0.074 | 9.167 ± 0.071 |
Met |
Asn |
Gln |
Pro |
Arg |
Ser |
Thr |
Val |
Trp |
Tyr |
|---|---|---|---|---|---|---|---|---|---|
2.373 ± 0.03 | 8.198 ± 0.087 |
2.408 ± 0.036 | 1.971 ± 0.036 |
2.989 ± 0.043 | 6.035 ± 0.051 |
5.478 ± 0.061 | 5.897 ± 0.065 |
0.543 ± 0.021 | 5.517 ± 0.076 |
Most of the basic statistics you can see at this page can be downloaded from this CSV file
See this proteome in:

Proteome-pI is available under Creative Commons Attribution-NoDerivs license, for more details see here
| Reference: Kozlowski LP. Proteome-pI 2.0: Proteome Isoelectric Point Database Update. Nucleic Acids Res. 2021, doi: 10.1093/nar/gkab944 | Contact: Lukasz P. Kozlowski |