Sutterella parvirubra YIT 11816
Taxonomy: cellular organisms; Bacteria; Proteobacteria; Betaproteobacteria; Burkholderiales; Sutterellaceae; Sutterella; Sutterella parvirubra
Average proteome isoelectric point is 6.71
Get precalculated fractions of proteins
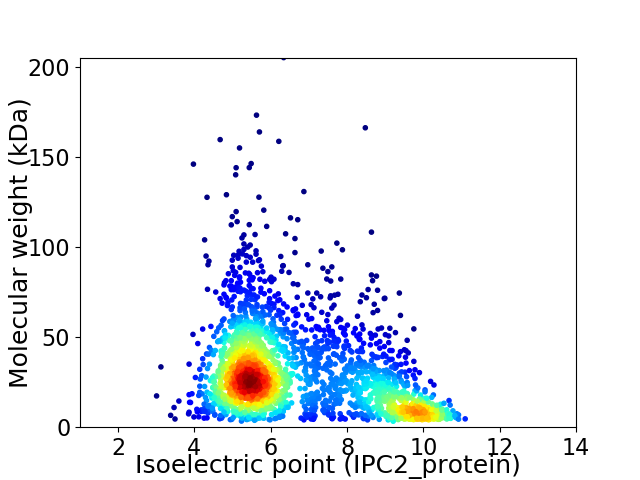
Virtual 2D-PAGE plot for 2483 proteins (isoelectric point calculated using IPC2_protein)
Get csv file with sequences according to given criteria:
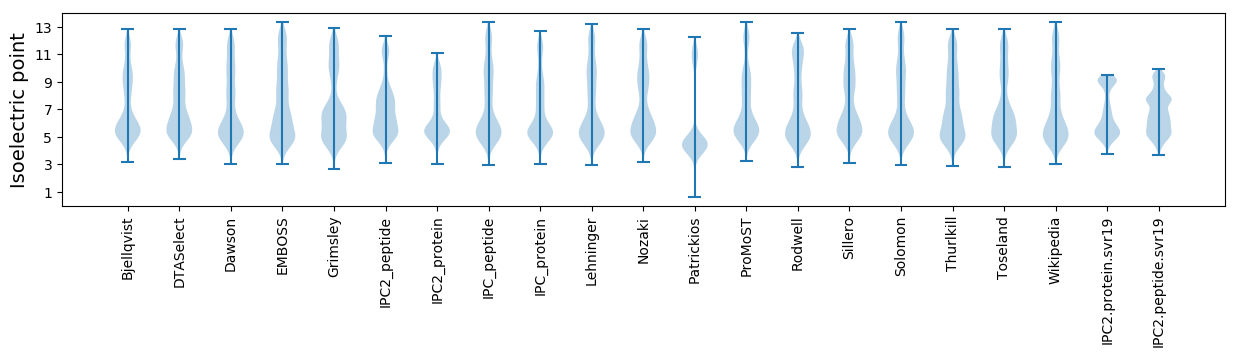
* You can choose from 21 different methods for calculating isoelectric point
Summary statistics related to proteome-wise predictions
Protein with the lowest isoelectric point:
>tr|H3KH85|H3KH85_9BURK Branched-chain amino acid ABC transporter permease protein OS=Sutterella parvirubra YIT 11816 OX=762967 GN=HMPREF9440_02126 PE=4 SV=1
AA1 pKa = 7.21LTAATAGEE9 pKa = 4.62AIKK12 pKa = 10.86LDD14 pKa = 3.75DD15 pKa = 5.27PYY17 pKa = 11.68SVTAGSQSNGKK28 pKa = 10.05LNVTISLTNSADD40 pKa = 3.28VSEE43 pKa = 5.09TYY45 pKa = 10.67DD46 pKa = 3.98LPIPVCSSQSS56 pKa = 3.06
AA1 pKa = 7.21LTAATAGEE9 pKa = 4.62AIKK12 pKa = 10.86LDD14 pKa = 3.75DD15 pKa = 5.27PYY17 pKa = 11.68SVTAGSQSNGKK28 pKa = 10.05LNVTISLTNSADD40 pKa = 3.28VSEE43 pKa = 5.09TYY45 pKa = 10.67DD46 pKa = 3.98LPIPVCSSQSS56 pKa = 3.06
Molecular weight: 5.67 kDa
Isoelectric point according different methods:
Protein with the highest isoelectric point:
>tr|H3KEZ4|H3KEZ4_9BURK Uncharacterized protein OS=Sutterella parvirubra YIT 11816 OX=762967 GN=HMPREF9440_01309 PE=4 SV=1
MM1 pKa = 7.5KK2 pKa = 10.06PRR4 pKa = 11.84VFRR7 pKa = 11.84RR8 pKa = 11.84TAGFAPKK15 pKa = 9.8RR16 pKa = 11.84AQIPRR21 pKa = 11.84PRR23 pKa = 11.84SLPKK27 pKa = 9.67KK28 pKa = 9.7RR29 pKa = 11.84PRR31 pKa = 11.84AGLSHH36 pKa = 7.43IFTPP40 pKa = 4.9
MM1 pKa = 7.5KK2 pKa = 10.06PRR4 pKa = 11.84VFRR7 pKa = 11.84RR8 pKa = 11.84TAGFAPKK15 pKa = 9.8RR16 pKa = 11.84AQIPRR21 pKa = 11.84PRR23 pKa = 11.84SLPKK27 pKa = 9.67KK28 pKa = 9.7RR29 pKa = 11.84PRR31 pKa = 11.84AGLSHH36 pKa = 7.43IFTPP40 pKa = 4.9
Molecular weight: 4.62 kDa
Isoelectric point according different methods:
Peptides (in silico digests for buttom-up proteomics)
Below you can find in silico digests of the whole proteome with Trypsin, Chymotrypsin, Trypsin+LysC, LysN, ArgC proteases suitable for different mass spec machines.| Try ESI |
 |
|---|
| ChTry ESI |
|
|---|
| ArgC ESI |
|
|---|
| LysN ESI |
|
|---|
| TryLysC ESI |
|
|---|
| Try MALDI |
|
|---|
| ChTry MALDI |
|
|---|
| ArgC MALDI |
|
|---|
| LysN MALDI |
|
|---|
| TryLysC MALDI |
|
|---|
| Try LTQ |
|
|---|
| ChTry LTQ |
|
|---|
| ArgC LTQ |
|
|---|
| LysN LTQ |
|
|---|
| TryLysC LTQ |
|
|---|
| Try MSlow |
|
|---|
| ChTry MSlow |
|
|---|
| ArgC MSlow |
|
|---|
| LysN MSlow |
|
|---|
| TryLysC MSlow |
|
|---|
| Try MShigh |
|
|---|
| ChTry MShigh |
|
|---|
| ArgC MShigh |
|
|---|
| LysN MShigh |
|
|---|
| TryLysC MShigh |
|
|---|
General Statistics
Number of major isoforms |
Number of additional isoforms |
Number of all proteins |
Number of amino acids |
Min. Seq. Length |
Max. Seq. Length |
Avg. Seq. Length |
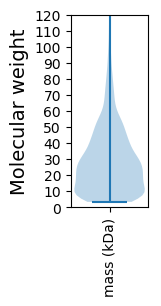
Avg. Mol. Weight |
|---|---|---|---|---|---|---|---|
0 |
698141 |
29 |
1883 |
281.2 |
30.66 |
Amino acid frequency
Ala |
Cys |
Asp |
Glu |
Phe |
Gly |
His |
Ile |
Lys |
Leu |
|---|---|---|---|---|---|---|---|---|---|
12.144 ± 0.084 | 1.052 ± 0.02 |
5.393 ± 0.045 | 6.792 ± 0.061 |
3.872 ± 0.033 | 8.242 ± 0.054 |
1.87 ± 0.025 | 4.509 ± 0.039 |
4.179 ± 0.039 | 9.678 ± 0.056 |
Met |
Asn |
Gln |
Pro |
Arg |
Ser |
Thr |
Val |
Trp |
Tyr |
|---|---|---|---|---|---|---|---|---|---|
2.671 ± 0.026 | 2.646 ± 0.03 |
5.18 ± 0.04 | 2.528 ± 0.027 |
7.178 ± 0.053 | 5.087 ± 0.036 |
5.693 ± 0.041 | 7.838 ± 0.045 |
1.36 ± 0.022 | 2.087 ± 0.026 |
Most of the basic statistics you can see at this page can be downloaded from this CSV file
See this proteome in:

Proteome-pI is available under Creative Commons Attribution-NoDerivs license, for more details see here
| Reference: Kozlowski LP. Proteome-pI 2.0: Proteome Isoelectric Point Database Update. Nucleic Acids Res. 2021, doi: 10.1093/nar/gkab944 | Contact: Lukasz P. Kozlowski |