Staphylococcus phage P954
Taxonomy: Viruses; Duplodnaviria; Heunggongvirae; Uroviricota; Caudoviricetes; Caudovirales; Siphoviridae; Bronfenbrennervirinae; Biseptimavirus; Staphylococcus virus P954
Average proteome isoelectric point is 6.3
Get precalculated fractions of proteins
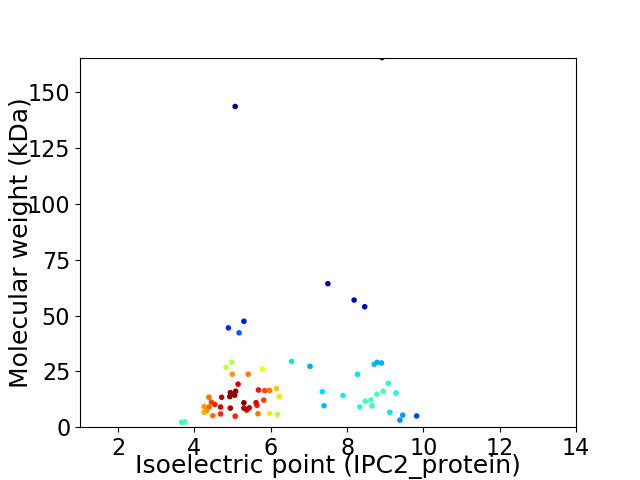
Virtual 2D-PAGE plot for 69 proteins (isoelectric point calculated using IPC2_protein)
Get csv file with sequences according to given criteria:
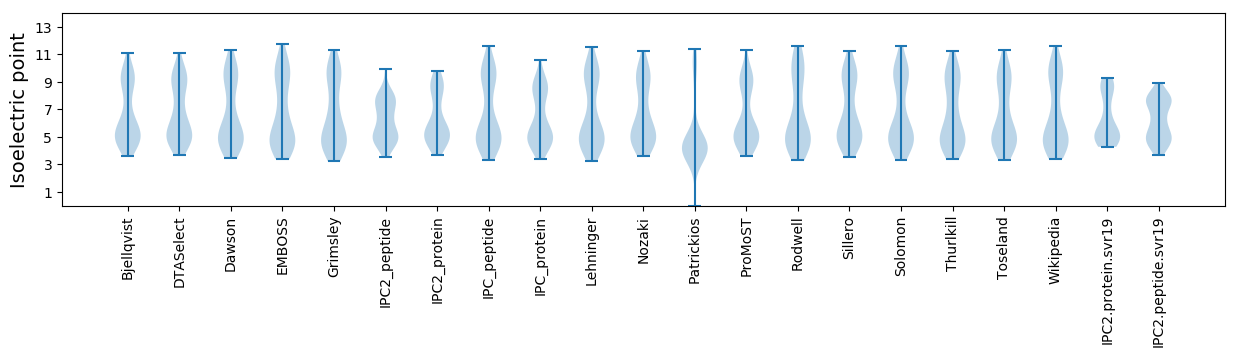
* You can choose from 21 different methods for calculating isoelectric point
Summary statistics related to proteome-wise predictions
Protein with the lowest isoelectric point:
>tr|C8CGZ9|C8CGZ9_9CAUD Uncharacterized protein OS=Staphylococcus phage P954 OX=668618 PE=4 SV=1
MM1 pKa = 6.89QQQAYY6 pKa = 9.38INATIDD12 pKa = 2.95IRR14 pKa = 11.84IPTEE18 pKa = 3.62VEE20 pKa = 3.88YY21 pKa = 11.25KK22 pKa = 10.83HH23 pKa = 6.73FDD25 pKa = 3.59DD26 pKa = 4.36VDD28 pKa = 3.71KK29 pKa = 11.35EE30 pKa = 4.28KK31 pKa = 10.38EE32 pKa = 4.13TLADD36 pKa = 3.51YY37 pKa = 10.84LYY39 pKa = 10.96NNPNEE44 pKa = 3.8ILEE47 pKa = 3.94YY48 pKa = 11.1DD49 pKa = 3.47NLKK52 pKa = 9.69IRR54 pKa = 11.84NVNVEE59 pKa = 3.93VEE61 pKa = 4.1
MM1 pKa = 6.89QQQAYY6 pKa = 9.38INATIDD12 pKa = 2.95IRR14 pKa = 11.84IPTEE18 pKa = 3.62VEE20 pKa = 3.88YY21 pKa = 11.25KK22 pKa = 10.83HH23 pKa = 6.73FDD25 pKa = 3.59DD26 pKa = 4.36VDD28 pKa = 3.71KK29 pKa = 11.35EE30 pKa = 4.28KK31 pKa = 10.38EE32 pKa = 4.13TLADD36 pKa = 3.51YY37 pKa = 10.84LYY39 pKa = 10.96NNPNEE44 pKa = 3.8ILEE47 pKa = 3.94YY48 pKa = 11.1DD49 pKa = 3.47NLKK52 pKa = 9.69IRR54 pKa = 11.84NVNVEE59 pKa = 3.93VEE61 pKa = 4.1
Molecular weight: 7.32 kDa
Isoelectric point according different methods:
Protein with the highest isoelectric point:
>tr|C8CH37|C8CH37_9CAUD Holin OS=Staphylococcus phage P954 OX=668618 PE=4 SV=1
MM1 pKa = 7.2VALLKK6 pKa = 10.65SLEE9 pKa = 3.97RR10 pKa = 11.84RR11 pKa = 11.84RR12 pKa = 11.84LMITISTMLQFGLFLIALIGLVIKK36 pKa = 10.76LIEE39 pKa = 4.3LSNKK43 pKa = 9.19KK44 pKa = 10.07
MM1 pKa = 7.2VALLKK6 pKa = 10.65SLEE9 pKa = 3.97RR10 pKa = 11.84RR11 pKa = 11.84RR12 pKa = 11.84LMITISTMLQFGLFLIALIGLVIKK36 pKa = 10.76LIEE39 pKa = 4.3LSNKK43 pKa = 9.19KK44 pKa = 10.07
Molecular weight: 5.03 kDa
Isoelectric point according different methods:
Peptides (in silico digests for buttom-up proteomics)
Below you can find in silico digests of the whole proteome with Trypsin, Chymotrypsin, Trypsin+LysC, LysN, ArgC proteases suitable for different mass spec machines.| Try ESI |
 |
|---|
| ChTry ESI |
|
|---|
| ArgC ESI |
|
|---|
| LysN ESI |
|
|---|
| TryLysC ESI |
|
|---|
| Try MALDI |
|
|---|
| ChTry MALDI |
|
|---|
| ArgC MALDI |
|
|---|
| LysN MALDI |
|
|---|
| TryLysC MALDI |
|
|---|
| Try LTQ |
|
|---|
| ChTry LTQ |
|
|---|
| ArgC LTQ |
|
|---|
| LysN LTQ |
|
|---|
| TryLysC LTQ |
|
|---|
| Try MSlow |
|
|---|
| ChTry MSlow |
|
|---|
| ArgC MSlow |
|
|---|
| LysN MSlow |
|
|---|
| TryLysC MSlow |
|
|---|
| Try MShigh |
|
|---|
| ChTry MShigh |
|
|---|
| ArgC MShigh |
|
|---|
| LysN MShigh |
|
|---|
| TryLysC MShigh |
|
|---|
General Statistics
Number of major isoforms |
Number of additional isoforms |
Number of all proteins |
Number of amino acids |
Min. Seq. Length |
Max. Seq. Length |
Avg. Seq. Length |
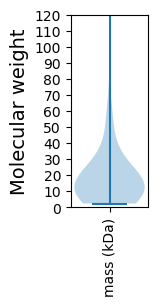
Avg. Mol. Weight |
|---|---|---|---|---|---|---|---|
0 |
12583 |
18 |
1509 |
182.4 |
20.99 |
Amino acid frequency
Ala |
Cys |
Asp |
Glu |
Phe |
Gly |
His |
Ile |
Lys |
Leu |
|---|---|---|---|---|---|---|---|---|---|
5.499 ± 0.471 | 0.532 ± 0.112 |
6.493 ± 0.336 | 8.217 ± 0.532 |
4.347 ± 0.324 | 5.754 ± 0.606 |
1.51 ± 0.132 | 7.772 ± 0.274 |
9.592 ± 0.355 | 8.162 ± 0.313 |
Met |
Asn |
Gln |
Pro |
Arg |
Ser |
Thr |
Val |
Trp |
Tyr |
|---|---|---|---|---|---|---|---|---|---|
2.543 ± 0.182 | 6.453 ± 0.271 |
2.583 ± 0.176 | 3.648 ± 0.201 |
4.45 ± 0.246 | 5.563 ± 0.276 |
5.428 ± 0.248 | 5.809 ± 0.238 |
1.176 ± 0.151 | 4.466 ± 0.352 |
Most of the basic statistics you can see at this page can be downloaded from this CSV file
See this proteome in:

Proteome-pI is available under Creative Commons Attribution-NoDerivs license, for more details see here
| Reference: Kozlowski LP. Proteome-pI 2.0: Proteome Isoelectric Point Database Update. Nucleic Acids Res. 2021, doi: 10.1093/nar/gkab944 | Contact: Lukasz P. Kozlowski |