Fretibacterium fastidiosum
Taxonomy: cellular organisms; Bacteria; Synergistetes; Synergistia; Synergistales; Synergistaceae; Fretibacterium
Average proteome isoelectric point is 6.49
Get precalculated fractions of proteins
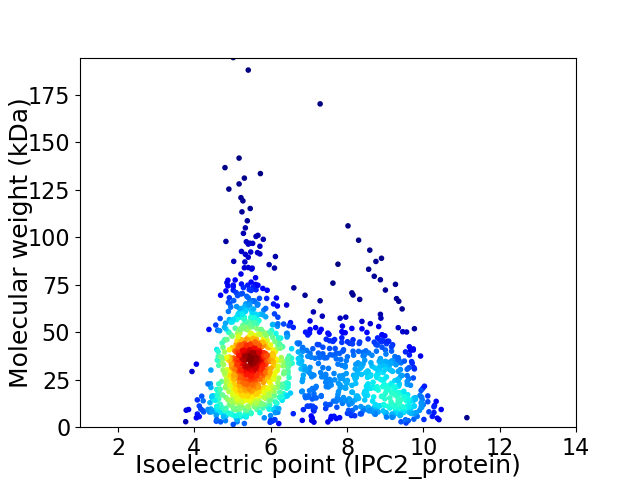
Virtual 2D-PAGE plot for 1434 proteins (isoelectric point calculated using IPC2_protein)
Get csv file with sequences according to given criteria:
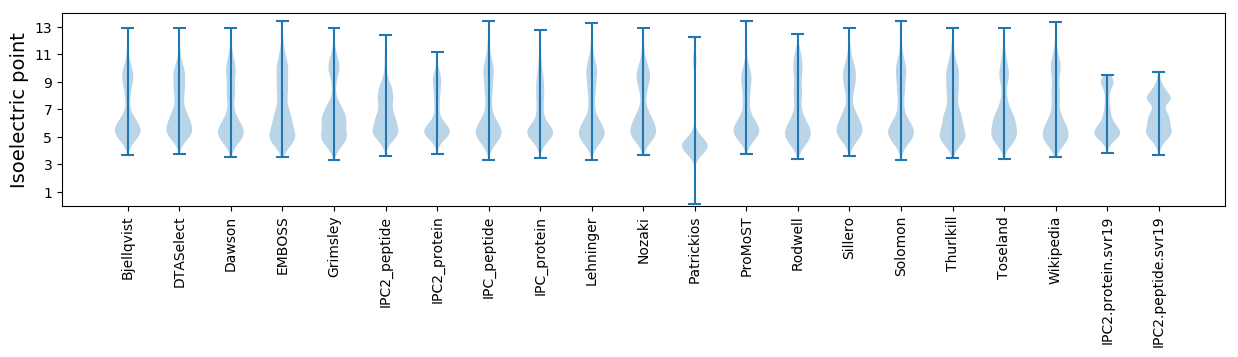
* You can choose from 21 different methods for calculating isoelectric point
Summary statistics related to proteome-wise predictions
Protein with the lowest isoelectric point:
>tr|D4M8K6|D4M8K6_9BACT NCAIR mutase (PurE)-related proteins OS=Fretibacterium fastidiosum OX=651822 GN=SY1_09440 PE=4 SV=1
MM1 pKa = 7.41EE2 pKa = 5.93WIKK5 pKa = 11.18APADD9 pKa = 3.71TPVCPEE15 pKa = 4.06KK16 pKa = 11.14NILLKK21 pKa = 10.87DD22 pKa = 3.65IVQLILDD29 pKa = 3.98GAEE32 pKa = 3.88TPEE35 pKa = 3.78AVMAEE40 pKa = 4.16LEE42 pKa = 4.33LTGTEE47 pKa = 4.36EE48 pKa = 4.43GTDD51 pKa = 3.76QIPAILDD58 pKa = 3.33VFVPVVNAWQTGICSGGCSGCSGGCCGEE86 pKa = 4.03
MM1 pKa = 7.41EE2 pKa = 5.93WIKK5 pKa = 11.18APADD9 pKa = 3.71TPVCPEE15 pKa = 4.06KK16 pKa = 11.14NILLKK21 pKa = 10.87DD22 pKa = 3.65IVQLILDD29 pKa = 3.98GAEE32 pKa = 3.88TPEE35 pKa = 3.78AVMAEE40 pKa = 4.16LEE42 pKa = 4.33LTGTEE47 pKa = 4.36EE48 pKa = 4.43GTDD51 pKa = 3.76QIPAILDD58 pKa = 3.33VFVPVVNAWQTGICSGGCSGCSGGCCGEE86 pKa = 4.03
Molecular weight: 8.95 kDa
Isoelectric point according different methods:
Protein with the highest isoelectric point:
>tr|D4M877|D4M877_9BACT Archaeal/vacuolar-type H+-ATPase subunit F OS=Fretibacterium fastidiosum OX=651822 GN=SY1_07380 PE=3 SV=1
MM1 pKa = 7.2LAVRR5 pKa = 11.84KK6 pKa = 9.82RR7 pKa = 11.84IPAPRR12 pKa = 11.84RR13 pKa = 11.84RR14 pKa = 11.84ASMRR18 pKa = 11.84AGTNTAKK25 pKa = 10.36VFPTPVGASRR35 pKa = 11.84ARR37 pKa = 11.84TAASASLRR45 pKa = 11.84NPP47 pKa = 3.35
MM1 pKa = 7.2LAVRR5 pKa = 11.84KK6 pKa = 9.82RR7 pKa = 11.84IPAPRR12 pKa = 11.84RR13 pKa = 11.84RR14 pKa = 11.84ASMRR18 pKa = 11.84AGTNTAKK25 pKa = 10.36VFPTPVGASRR35 pKa = 11.84ARR37 pKa = 11.84TAASASLRR45 pKa = 11.84NPP47 pKa = 3.35
Molecular weight: 5.02 kDa
Isoelectric point according different methods:
Peptides (in silico digests for buttom-up proteomics)
Below you can find in silico digests of the whole proteome with Trypsin, Chymotrypsin, Trypsin+LysC, LysN, ArgC proteases suitable for different mass spec machines.| Try ESI |
 |
|---|
| ChTry ESI |
|
|---|
| ArgC ESI |
|
|---|
| LysN ESI |
|
|---|
| TryLysC ESI |
|
|---|
| Try MALDI |
|
|---|
| ChTry MALDI |
|
|---|
| ArgC MALDI |
|
|---|
| LysN MALDI |
|
|---|
| TryLysC MALDI |
|
|---|
| Try LTQ |
|
|---|
| ChTry LTQ |
|
|---|
| ArgC LTQ |
|
|---|
| LysN LTQ |
|
|---|
| TryLysC LTQ |
|
|---|
| Try MSlow |
|
|---|
| ChTry MSlow |
|
|---|
| ArgC MSlow |
|
|---|
| LysN MSlow |
|
|---|
| TryLysC MSlow |
|
|---|
| Try MShigh |
|
|---|
| ChTry MShigh |
|
|---|
| ArgC MShigh |
|
|---|
| LysN MShigh |
|
|---|
| TryLysC MShigh |
|
|---|
General Statistics
Number of major isoforms |
Number of additional isoforms |
Number of all proteins |
Number of amino acids |
Min. Seq. Length |
Max. Seq. Length |
Avg. Seq. Length |
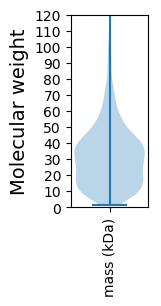
Avg. Mol. Weight |
|---|---|---|---|---|---|---|---|
0 |
431014 |
14 |
1779 |
300.6 |
32.97 |
Amino acid frequency
Ala |
Cys |
Asp |
Glu |
Phe |
Gly |
His |
Ile |
Lys |
Leu |
|---|---|---|---|---|---|---|---|---|---|
10.543 ± 0.089 | 1.35 ± 0.027 |
5.399 ± 0.041 | 6.669 ± 0.072 |
3.905 ± 0.045 | 8.615 ± 0.057 |
1.659 ± 0.026 | 4.98 ± 0.061 |
4.122 ± 0.055 | 10.546 ± 0.079 |
Met |
Asn |
Gln |
Pro |
Arg |
Ser |
Thr |
Val |
Trp |
Tyr |
|---|---|---|---|---|---|---|---|---|---|
2.886 ± 0.031 | 2.854 ± 0.038 |
4.519 ± 0.047 | 2.711 ± 0.036 |
7.109 ± 0.079 | 5.64 ± 0.047 |
4.852 ± 0.045 | 7.77 ± 0.053 |
1.271 ± 0.027 | 2.6 ± 0.034 |
Most of the basic statistics you can see at this page can be downloaded from this CSV file
See this proteome in:

Proteome-pI is available under Creative Commons Attribution-NoDerivs license, for more details see here
| Reference: Kozlowski LP. Proteome-pI 2.0: Proteome Isoelectric Point Database Update. Nucleic Acids Res. 2021, doi: 10.1093/nar/gkab944 | Contact: Lukasz P. Kozlowski |