Kocuria coralli
Taxonomy: cellular organisms; Bacteria; Terrabacteria group; Actinobacteria; Actinomycetia; Micrococcales; Micrococcaceae; Kocuria
Average proteome isoelectric point is 5.98
Get precalculated fractions of proteins
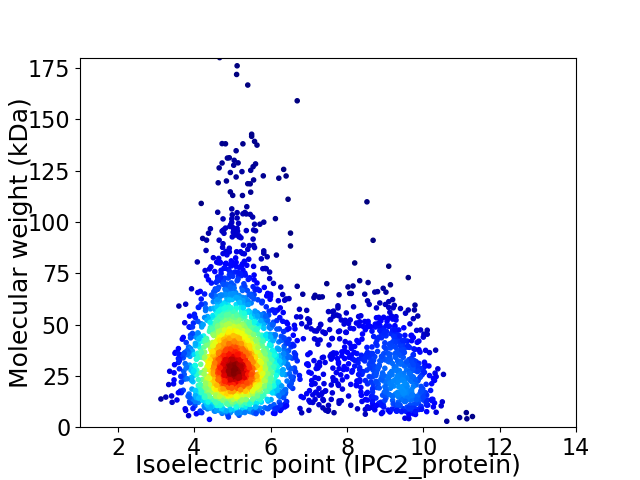
Virtual 2D-PAGE plot for 2933 proteins (isoelectric point calculated using IPC2_protein)
Get csv file with sequences according to given criteria:
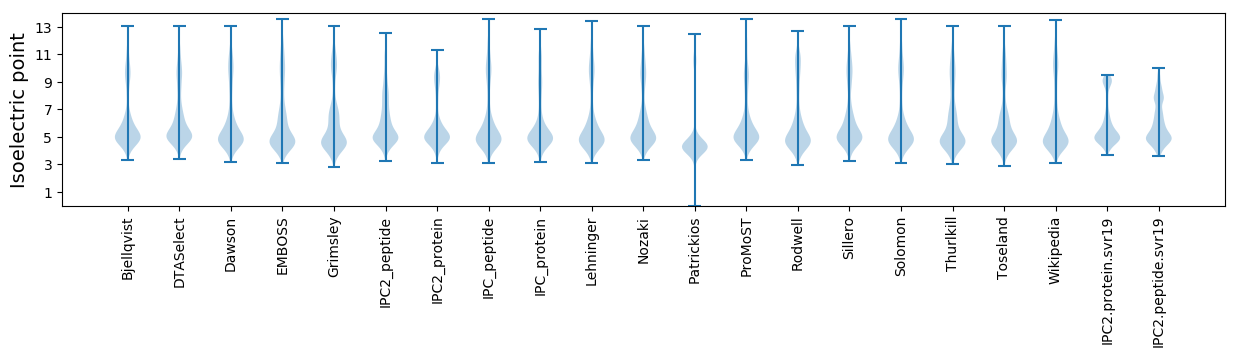
* You can choose from 21 different methods for calculating isoelectric point
Summary statistics related to proteome-wise predictions
Protein with the lowest isoelectric point:
>tr|A0A5J5L0G3|A0A5J5L0G3_9MICC Protein translocase subunit SecF OS=Kocuria coralli OX=1461025 GN=secF PE=4 SV=1
MM1 pKa = 6.1TTTRR5 pKa = 11.84RR6 pKa = 11.84RR7 pKa = 11.84CAAAALAAAFVLAGCSGGDD26 pKa = 3.45DD27 pKa = 4.12GEE29 pKa = 4.42GAEE32 pKa = 4.64ADD34 pKa = 3.78GGSGSFPSQPINLIVPYY51 pKa = 10.1AAGGSADD58 pKa = 3.29STARR62 pKa = 11.84QLAAVAQDD70 pKa = 3.34TCGAPIIIRR79 pKa = 11.84NATGGSGAVGFQATLSSPADD99 pKa = 3.99GYY101 pKa = 9.26TVGSASIEE109 pKa = 4.1LTMLDD114 pKa = 3.34HH115 pKa = 6.45MGISEE120 pKa = 4.22IHH122 pKa = 6.51PDD124 pKa = 3.76DD125 pKa = 4.03YY126 pKa = 11.71EE127 pKa = 6.64GILQYY132 pKa = 10.59SEE134 pKa = 3.85QPIVFGVPADD144 pKa = 3.65SPYY147 pKa = 11.04QSLQDD152 pKa = 4.51VIDD155 pKa = 3.8SDD157 pKa = 4.88DD158 pKa = 3.77RR159 pKa = 11.84VTVATSGTGGIYY171 pKa = 10.18HH172 pKa = 7.46LGYY175 pKa = 11.01EE176 pKa = 4.51SMALAAGIDD185 pKa = 3.73DD186 pKa = 3.7RR187 pKa = 11.84TVNVPFDD194 pKa = 3.72GAASALQAALGDD206 pKa = 3.73QTAMVSVGAAEE217 pKa = 4.05MRR219 pKa = 11.84PHH221 pKa = 6.95IEE223 pKa = 3.81SGAIRR228 pKa = 11.84PLAIAGDD235 pKa = 3.9PVDD238 pKa = 4.77YY239 pKa = 10.82LPEE242 pKa = 4.43DD243 pKa = 3.76VPTLHH248 pKa = 6.97EE249 pKa = 4.74LGIDD253 pKa = 3.79SEE255 pKa = 4.84TTAILGLYY263 pKa = 9.55APAGVPQDD271 pKa = 3.78RR272 pKa = 11.84IEE274 pKa = 4.54LLNEE278 pKa = 3.99CFNEE282 pKa = 4.1ARR284 pKa = 11.84EE285 pKa = 4.08SDD287 pKa = 3.69QFSDD291 pKa = 3.72YY292 pKa = 11.06MEE294 pKa = 4.37TTGLNQRR301 pKa = 11.84YY302 pKa = 9.18RR303 pKa = 11.84DD304 pKa = 3.82AQEE307 pKa = 4.29FDD309 pKa = 2.92QFMGEE314 pKa = 3.96EE315 pKa = 4.02YY316 pKa = 10.87DD317 pKa = 4.53RR318 pKa = 11.84FGEE321 pKa = 4.45LIDD324 pKa = 4.44EE325 pKa = 4.62IGMGVHH331 pKa = 7.08
MM1 pKa = 6.1TTTRR5 pKa = 11.84RR6 pKa = 11.84RR7 pKa = 11.84CAAAALAAAFVLAGCSGGDD26 pKa = 3.45DD27 pKa = 4.12GEE29 pKa = 4.42GAEE32 pKa = 4.64ADD34 pKa = 3.78GGSGSFPSQPINLIVPYY51 pKa = 10.1AAGGSADD58 pKa = 3.29STARR62 pKa = 11.84QLAAVAQDD70 pKa = 3.34TCGAPIIIRR79 pKa = 11.84NATGGSGAVGFQATLSSPADD99 pKa = 3.99GYY101 pKa = 9.26TVGSASIEE109 pKa = 4.1LTMLDD114 pKa = 3.34HH115 pKa = 6.45MGISEE120 pKa = 4.22IHH122 pKa = 6.51PDD124 pKa = 3.76DD125 pKa = 4.03YY126 pKa = 11.71EE127 pKa = 6.64GILQYY132 pKa = 10.59SEE134 pKa = 3.85QPIVFGVPADD144 pKa = 3.65SPYY147 pKa = 11.04QSLQDD152 pKa = 4.51VIDD155 pKa = 3.8SDD157 pKa = 4.88DD158 pKa = 3.77RR159 pKa = 11.84VTVATSGTGGIYY171 pKa = 10.18HH172 pKa = 7.46LGYY175 pKa = 11.01EE176 pKa = 4.51SMALAAGIDD185 pKa = 3.73DD186 pKa = 3.7RR187 pKa = 11.84TVNVPFDD194 pKa = 3.72GAASALQAALGDD206 pKa = 3.73QTAMVSVGAAEE217 pKa = 4.05MRR219 pKa = 11.84PHH221 pKa = 6.95IEE223 pKa = 3.81SGAIRR228 pKa = 11.84PLAIAGDD235 pKa = 3.9PVDD238 pKa = 4.77YY239 pKa = 10.82LPEE242 pKa = 4.43DD243 pKa = 3.76VPTLHH248 pKa = 6.97EE249 pKa = 4.74LGIDD253 pKa = 3.79SEE255 pKa = 4.84TTAILGLYY263 pKa = 9.55APAGVPQDD271 pKa = 3.78RR272 pKa = 11.84IEE274 pKa = 4.54LLNEE278 pKa = 3.99CFNEE282 pKa = 4.1ARR284 pKa = 11.84EE285 pKa = 4.08SDD287 pKa = 3.69QFSDD291 pKa = 3.72YY292 pKa = 11.06MEE294 pKa = 4.37TTGLNQRR301 pKa = 11.84YY302 pKa = 9.18RR303 pKa = 11.84DD304 pKa = 3.82AQEE307 pKa = 4.29FDD309 pKa = 2.92QFMGEE314 pKa = 3.96EE315 pKa = 4.02YY316 pKa = 10.87DD317 pKa = 4.53RR318 pKa = 11.84FGEE321 pKa = 4.45LIDD324 pKa = 4.44EE325 pKa = 4.62IGMGVHH331 pKa = 7.08
Molecular weight: 34.56 kDa
Isoelectric point according different methods:
Protein with the highest isoelectric point:
>tr|A0A5J5KZH5|A0A5J5KZH5_9MICC Acetamidase OS=Kocuria coralli OX=1461025 GN=FCK90_06135 PE=4 SV=1
MM1 pKa = 7.69SKK3 pKa = 9.0RR4 pKa = 11.84TFQPNNRR11 pKa = 11.84RR12 pKa = 11.84RR13 pKa = 11.84AKK15 pKa = 10.04KK16 pKa = 8.86HH17 pKa = 4.36GFRR20 pKa = 11.84ARR22 pKa = 11.84MRR24 pKa = 11.84TRR26 pKa = 11.84AGRR29 pKa = 11.84AILSARR35 pKa = 11.84RR36 pKa = 11.84SKK38 pKa = 10.82GRR40 pKa = 11.84ASLSAA45 pKa = 3.83
MM1 pKa = 7.69SKK3 pKa = 9.0RR4 pKa = 11.84TFQPNNRR11 pKa = 11.84RR12 pKa = 11.84RR13 pKa = 11.84AKK15 pKa = 10.04KK16 pKa = 8.86HH17 pKa = 4.36GFRR20 pKa = 11.84ARR22 pKa = 11.84MRR24 pKa = 11.84TRR26 pKa = 11.84AGRR29 pKa = 11.84AILSARR35 pKa = 11.84RR36 pKa = 11.84SKK38 pKa = 10.82GRR40 pKa = 11.84ASLSAA45 pKa = 3.83
Molecular weight: 5.2 kDa
Isoelectric point according different methods:
Peptides (in silico digests for buttom-up proteomics)
Below you can find in silico digests of the whole proteome with Trypsin, Chymotrypsin, Trypsin+LysC, LysN, ArgC proteases suitable for different mass spec machines.| Try ESI |
 |
|---|
| ChTry ESI |
|
|---|
| ArgC ESI |
|
|---|
| LysN ESI |
|
|---|
| TryLysC ESI |
|
|---|
| Try MALDI |
|
|---|
| ChTry MALDI |
|
|---|
| ArgC MALDI |
|
|---|
| LysN MALDI |
|
|---|
| TryLysC MALDI |
|
|---|
| Try LTQ |
|
|---|
| ChTry LTQ |
|
|---|
| ArgC LTQ |
|
|---|
| LysN LTQ |
|
|---|
| TryLysC LTQ |
|
|---|
| Try MSlow |
|
|---|
| ChTry MSlow |
|
|---|
| ArgC MSlow |
|
|---|
| LysN MSlow |
|
|---|
| TryLysC MSlow |
|
|---|
| Try MShigh |
|
|---|
| ChTry MShigh |
|
|---|
| ArgC MShigh |
|
|---|
| LysN MShigh |
|
|---|
| TryLysC MShigh |
|
|---|
General Statistics
Number of major isoforms |
Number of additional isoforms |
Number of all proteins |
Number of amino acids |
Min. Seq. Length |
Max. Seq. Length |
Avg. Seq. Length |
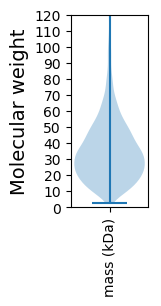
Avg. Mol. Weight |
|---|---|---|---|---|---|---|---|
0 |
998786 |
24 |
1646 |
340.5 |
36.61 |
Amino acid frequency
Ala |
Cys |
Asp |
Glu |
Phe |
Gly |
His |
Ile |
Lys |
Leu |
|---|---|---|---|---|---|---|---|---|---|
12.452 ± 0.052 | 0.627 ± 0.01 |
6.056 ± 0.036 | 6.268 ± 0.041 |
2.965 ± 0.026 | 9.184 ± 0.04 |
2.191 ± 0.021 | 4.217 ± 0.034 |
2.078 ± 0.032 | 9.978 ± 0.049 |
Met |
Asn |
Gln |
Pro |
Arg |
Ser |
Thr |
Val |
Trp |
Tyr |
|---|---|---|---|---|---|---|---|---|---|
2.061 ± 0.02 | 2.023 ± 0.022 |
5.576 ± 0.037 | 3.208 ± 0.023 |
7.353 ± 0.047 | 5.764 ± 0.027 |
5.882 ± 0.03 | 8.645 ± 0.039 |
1.519 ± 0.02 | 1.954 ± 0.021 |
Most of the basic statistics you can see at this page can be downloaded from this CSV file
See this proteome in:

Proteome-pI is available under Creative Commons Attribution-NoDerivs license, for more details see here
| Reference: Kozlowski LP. Proteome-pI 2.0: Proteome Isoelectric Point Database Update. Nucleic Acids Res. 2021, doi: 10.1093/nar/gkab944 | Contact: Lukasz P. Kozlowski |