Oenococcus kitaharae DSM 17330
Taxonomy: cellular organisms; Bacteria; Terrabacteria group; Firmicutes; Bacilli; Lactobacillales; Lactobacillaceae; Oenococcus; Oenococcus kitaharae
Average proteome isoelectric point is 6.9
Get precalculated fractions of proteins
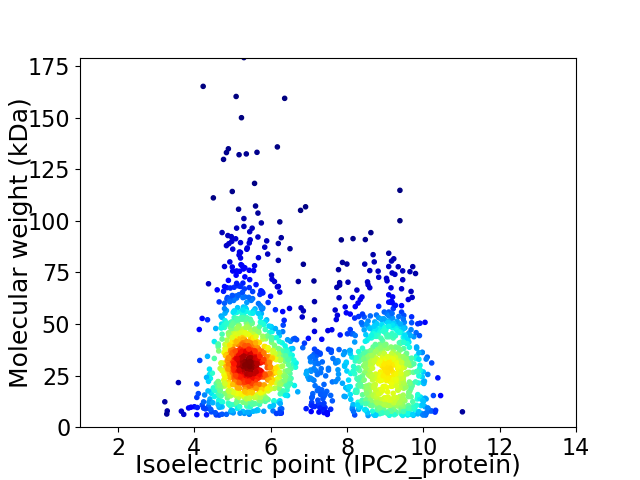
Virtual 2D-PAGE plot for 1818 proteins (isoelectric point calculated using IPC2_protein)
Get csv file with sequences according to given criteria:
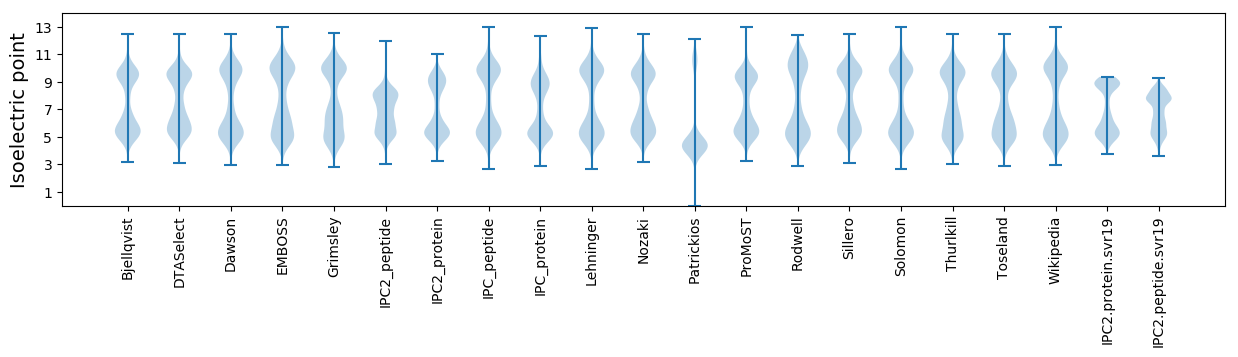
* You can choose from 21 different methods for calculating isoelectric point
Summary statistics related to proteome-wise predictions
Protein with the lowest isoelectric point:
>tr|G9WFS3|G9WFS3_9LACO Isopentenyl-diphosphate delta-isomerase OS=Oenococcus kitaharae DSM 17330 OX=1045004 GN=fni PE=3 SV=1
MM1 pKa = 8.04DD2 pKa = 5.45FEE4 pKa = 5.6DD5 pKa = 4.68LQALTDD11 pKa = 4.2LDD13 pKa = 4.03EE14 pKa = 6.09ADD16 pKa = 4.46LVVALNHH23 pKa = 5.4LHH25 pKa = 7.62DD26 pKa = 5.63RR27 pKa = 11.84GLLFNGYY34 pKa = 8.87IDD36 pKa = 4.27EE37 pKa = 4.4EE38 pKa = 4.37TGEE41 pKa = 4.43VVTDD45 pKa = 4.46DD46 pKa = 3.61IGYY49 pKa = 10.04LYY51 pKa = 11.1KK52 pKa = 10.79LANN55 pKa = 3.63
MM1 pKa = 8.04DD2 pKa = 5.45FEE4 pKa = 5.6DD5 pKa = 4.68LQALTDD11 pKa = 4.2LDD13 pKa = 4.03EE14 pKa = 6.09ADD16 pKa = 4.46LVVALNHH23 pKa = 5.4LHH25 pKa = 7.62DD26 pKa = 5.63RR27 pKa = 11.84GLLFNGYY34 pKa = 8.87IDD36 pKa = 4.27EE37 pKa = 4.4EE38 pKa = 4.37TGEE41 pKa = 4.43VVTDD45 pKa = 4.46DD46 pKa = 3.61IGYY49 pKa = 10.04LYY51 pKa = 11.1KK52 pKa = 10.79LANN55 pKa = 3.63
Molecular weight: 6.21 kDa
Isoelectric point according different methods:
Protein with the highest isoelectric point:
>tr|G9WJR9|G9WJR9_9LACO Peptide chain release factor 3 OS=Oenococcus kitaharae DSM 17330 OX=1045004 GN=prfC PE=3 SV=1
MM1 pKa = 7.88PKK3 pKa = 9.48MKK5 pKa = 10.02TSRR8 pKa = 11.84ASAKK12 pKa = 9.94RR13 pKa = 11.84FKK15 pKa = 9.66KK16 pKa = 8.39TASGGFKK23 pKa = 10.21SGQAFTSHH31 pKa = 6.83RR32 pKa = 11.84FHH34 pKa = 7.48GKK36 pKa = 6.37TKK38 pKa = 9.57KK39 pKa = 9.41QRR41 pKa = 11.84RR42 pKa = 11.84QLRR45 pKa = 11.84GTAMMNRR52 pKa = 11.84INVKK56 pKa = 9.78RR57 pKa = 11.84YY58 pKa = 10.15AKK60 pKa = 10.44VLSNLL65 pKa = 3.51
MM1 pKa = 7.88PKK3 pKa = 9.48MKK5 pKa = 10.02TSRR8 pKa = 11.84ASAKK12 pKa = 9.94RR13 pKa = 11.84FKK15 pKa = 9.66KK16 pKa = 8.39TASGGFKK23 pKa = 10.21SGQAFTSHH31 pKa = 6.83RR32 pKa = 11.84FHH34 pKa = 7.48GKK36 pKa = 6.37TKK38 pKa = 9.57KK39 pKa = 9.41QRR41 pKa = 11.84RR42 pKa = 11.84QLRR45 pKa = 11.84GTAMMNRR52 pKa = 11.84INVKK56 pKa = 9.78RR57 pKa = 11.84YY58 pKa = 10.15AKK60 pKa = 10.44VLSNLL65 pKa = 3.51
Molecular weight: 7.44 kDa
Isoelectric point according different methods:
Peptides (in silico digests for buttom-up proteomics)
Below you can find in silico digests of the whole proteome with Trypsin, Chymotrypsin, Trypsin+LysC, LysN, ArgC proteases suitable for different mass spec machines.| Try ESI |
 |
|---|
| ChTry ESI |
|
|---|
| ArgC ESI |
|
|---|
| LysN ESI |
|
|---|
| TryLysC ESI |
|
|---|
| Try MALDI |
|
|---|
| ChTry MALDI |
|
|---|
| ArgC MALDI |
|
|---|
| LysN MALDI |
|
|---|
| TryLysC MALDI |
|
|---|
| Try LTQ |
|
|---|
| ChTry LTQ |
|
|---|
| ArgC LTQ |
|
|---|
| LysN LTQ |
|
|---|
| TryLysC LTQ |
|
|---|
| Try MSlow |
|
|---|
| ChTry MSlow |
|
|---|
| ArgC MSlow |
|
|---|
| LysN MSlow |
|
|---|
| TryLysC MSlow |
|
|---|
| Try MShigh |
|
|---|
| ChTry MShigh |
|
|---|
| ArgC MShigh |
|
|---|
| LysN MShigh |
|
|---|
| TryLysC MShigh |
|
|---|
General Statistics
Number of major isoforms |
Number of additional isoforms |
Number of all proteins |
Number of amino acids |
Min. Seq. Length |
Max. Seq. Length |
Avg. Seq. Length |
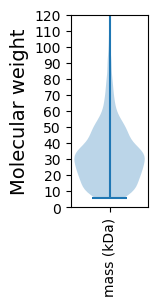
Avg. Mol. Weight |
|---|---|---|---|---|---|---|---|
0 |
551158 |
50 |
1583 |
303.2 |
33.8 |
Amino acid frequency
Ala |
Cys |
Asp |
Glu |
Phe |
Gly |
His |
Ile |
Lys |
Leu |
|---|---|---|---|---|---|---|---|---|---|
8.737 ± 0.062 | 0.33 ± 0.011 |
5.967 ± 0.06 | 4.786 ± 0.058 |
4.878 ± 0.054 | 6.481 ± 0.047 |
2.108 ± 0.027 | 7.359 ± 0.051 |
6.24 ± 0.056 | 10.279 ± 0.067 |
Met |
Asn |
Gln |
Pro |
Arg |
Ser |
Thr |
Val |
Trp |
Tyr |
|---|---|---|---|---|---|---|---|---|---|
2.414 ± 0.026 | 4.675 ± 0.037 |
3.579 ± 0.032 | 4.886 ± 0.048 |
4.245 ± 0.041 | 6.621 ± 0.044 |
5.448 ± 0.039 | 6.5 ± 0.043 |
1.058 ± 0.023 | 3.407 ± 0.031 |
Most of the basic statistics you can see at this page can be downloaded from this CSV file
See this proteome in:

Proteome-pI is available under Creative Commons Attribution-NoDerivs license, for more details see here
| Reference: Kozlowski LP. Proteome-pI 2.0: Proteome Isoelectric Point Database Update. Nucleic Acids Res. 2021, doi: 10.1093/nar/gkab944 | Contact: Lukasz P. Kozlowski |