Marinobacter santoriniensis NKSG1
Taxonomy: cellular organisms; Bacteria; Proteobacteria; Gammaproteobacteria; Alteromonadales; Alteromonadaceae; Marinobacter; Marinobacter santoriniensis
Average proteome isoelectric point is 6.09
Get precalculated fractions of proteins
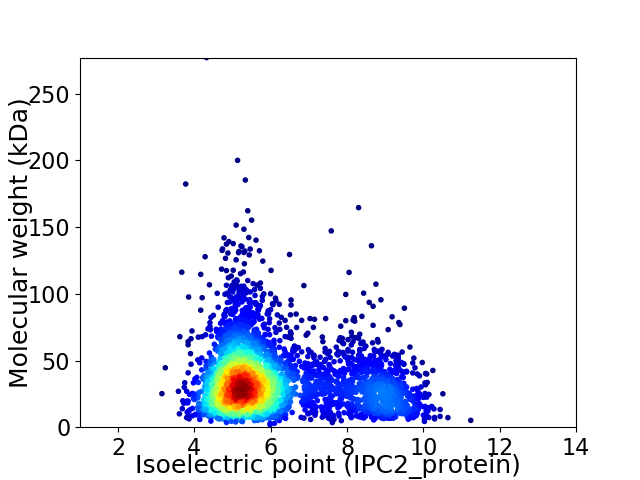
Virtual 2D-PAGE plot for 3692 proteins (isoelectric point calculated using IPC2_protein)
Get csv file with sequences according to given criteria:
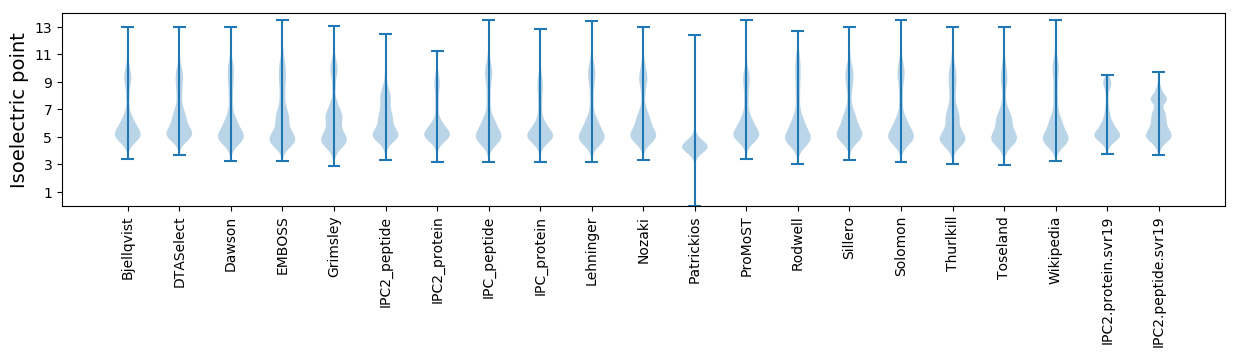
* You can choose from 21 different methods for calculating isoelectric point
Summary statistics related to proteome-wise predictions
Protein with the lowest isoelectric point:
>tr|M7CKV5|M7CKV5_9ALTE Histidine kinase OS=Marinobacter santoriniensis NKSG1 OX=1288826 GN=MSNKSG1_16161 PE=4 SV=1
MM1 pKa = 7.15KK2 pKa = 10.33RR3 pKa = 11.84SMQMFAVSALAAGVAACGGGGDD25 pKa = 4.2GSATGSTGTVSFNMTDD41 pKa = 3.23APAMEE46 pKa = 4.46FTDD49 pKa = 3.34VTVAFTGIRR58 pKa = 11.84LKK60 pKa = 11.04HH61 pKa = 6.39EE62 pKa = 4.79DD63 pKa = 3.79GDD65 pKa = 4.2WIEE68 pKa = 4.24FTFDD72 pKa = 4.87QPKK75 pKa = 8.18TWNLLDD81 pKa = 3.93LQGGMHH87 pKa = 6.81EE88 pKa = 4.31PLITDD93 pKa = 3.75EE94 pKa = 4.48EE95 pKa = 5.05VPAGDD100 pKa = 3.7YY101 pKa = 10.69TEE103 pKa = 4.47LRR105 pKa = 11.84LMVDD109 pKa = 3.14TADD112 pKa = 3.67SYY114 pKa = 11.83VIEE117 pKa = 4.47SSQPDD122 pKa = 3.75VEE124 pKa = 4.43KK125 pKa = 10.32TLAVPSGEE133 pKa = 4.13QSGLKK138 pKa = 10.35LKK140 pKa = 11.14GNFVVAADD148 pKa = 3.81TSTDD152 pKa = 3.65FTIDD156 pKa = 3.36FNVAKK161 pKa = 10.52SIVNPQGKK169 pKa = 9.05SLADD173 pKa = 3.58YY174 pKa = 10.53LLKK177 pKa = 10.66PSLRR181 pKa = 11.84LTNTLEE187 pKa = 4.2TGSITGEE194 pKa = 3.48VDD196 pKa = 3.31YY197 pKa = 8.81PTINSTRR204 pKa = 11.84SADD207 pKa = 3.59ADD209 pKa = 3.94LANCSDD215 pKa = 4.07GYY217 pKa = 10.68YY218 pKa = 10.88GSIYY222 pKa = 9.85VYY224 pKa = 10.1QGAGVTPTDD233 pKa = 3.47VNVNTEE239 pKa = 4.76DD240 pKa = 4.09GPLMTIPVKK249 pKa = 10.78DD250 pKa = 4.09DD251 pKa = 4.01NNDD254 pKa = 2.89GMYY257 pKa = 10.16SYY259 pKa = 9.69TAAYY263 pKa = 8.26LTEE266 pKa = 4.31GDD268 pKa = 3.68YY269 pKa = 10.68TLSYY273 pKa = 10.14TCQLDD278 pKa = 4.23DD279 pKa = 5.77NEE281 pKa = 4.67TTDD284 pKa = 3.7DD285 pKa = 3.63TVEE288 pKa = 4.12FEE290 pKa = 4.3GTQTVSVVAGEE301 pKa = 4.07EE302 pKa = 4.15TQADD306 pKa = 4.73SIPLTPP312 pKa = 4.83
MM1 pKa = 7.15KK2 pKa = 10.33RR3 pKa = 11.84SMQMFAVSALAAGVAACGGGGDD25 pKa = 4.2GSATGSTGTVSFNMTDD41 pKa = 3.23APAMEE46 pKa = 4.46FTDD49 pKa = 3.34VTVAFTGIRR58 pKa = 11.84LKK60 pKa = 11.04HH61 pKa = 6.39EE62 pKa = 4.79DD63 pKa = 3.79GDD65 pKa = 4.2WIEE68 pKa = 4.24FTFDD72 pKa = 4.87QPKK75 pKa = 8.18TWNLLDD81 pKa = 3.93LQGGMHH87 pKa = 6.81EE88 pKa = 4.31PLITDD93 pKa = 3.75EE94 pKa = 4.48EE95 pKa = 5.05VPAGDD100 pKa = 3.7YY101 pKa = 10.69TEE103 pKa = 4.47LRR105 pKa = 11.84LMVDD109 pKa = 3.14TADD112 pKa = 3.67SYY114 pKa = 11.83VIEE117 pKa = 4.47SSQPDD122 pKa = 3.75VEE124 pKa = 4.43KK125 pKa = 10.32TLAVPSGEE133 pKa = 4.13QSGLKK138 pKa = 10.35LKK140 pKa = 11.14GNFVVAADD148 pKa = 3.81TSTDD152 pKa = 3.65FTIDD156 pKa = 3.36FNVAKK161 pKa = 10.52SIVNPQGKK169 pKa = 9.05SLADD173 pKa = 3.58YY174 pKa = 10.53LLKK177 pKa = 10.66PSLRR181 pKa = 11.84LTNTLEE187 pKa = 4.2TGSITGEE194 pKa = 3.48VDD196 pKa = 3.31YY197 pKa = 8.81PTINSTRR204 pKa = 11.84SADD207 pKa = 3.59ADD209 pKa = 3.94LANCSDD215 pKa = 4.07GYY217 pKa = 10.68YY218 pKa = 10.88GSIYY222 pKa = 9.85VYY224 pKa = 10.1QGAGVTPTDD233 pKa = 3.47VNVNTEE239 pKa = 4.76DD240 pKa = 4.09GPLMTIPVKK249 pKa = 10.78DD250 pKa = 4.09DD251 pKa = 4.01NNDD254 pKa = 2.89GMYY257 pKa = 10.16SYY259 pKa = 9.69TAAYY263 pKa = 8.26LTEE266 pKa = 4.31GDD268 pKa = 3.68YY269 pKa = 10.68TLSYY273 pKa = 10.14TCQLDD278 pKa = 4.23DD279 pKa = 5.77NEE281 pKa = 4.67TTDD284 pKa = 3.7DD285 pKa = 3.63TVEE288 pKa = 4.12FEE290 pKa = 4.3GTQTVSVVAGEE301 pKa = 4.07EE302 pKa = 4.15TQADD306 pKa = 4.73SIPLTPP312 pKa = 4.83
Molecular weight: 33.3 kDa
Isoelectric point according different methods:
Protein with the highest isoelectric point:
>tr|M7CRC4|M7CRC4_9ALTE Proton/sodium-glutamate symport protein OS=Marinobacter santoriniensis NKSG1 OX=1288826 GN=MSNKSG1_09968 PE=4 SV=1
MM1 pKa = 7.45KK2 pKa = 9.51RR3 pKa = 11.84TFQPSVLKK11 pKa = 10.34RR12 pKa = 11.84KK13 pKa = 9.1RR14 pKa = 11.84VHH16 pKa = 6.26GFRR19 pKa = 11.84ARR21 pKa = 11.84MATANGRR28 pKa = 11.84KK29 pKa = 8.91VLSRR33 pKa = 11.84RR34 pKa = 11.84RR35 pKa = 11.84AKK37 pKa = 10.44GRR39 pKa = 11.84ARR41 pKa = 11.84LSAA44 pKa = 3.91
MM1 pKa = 7.45KK2 pKa = 9.51RR3 pKa = 11.84TFQPSVLKK11 pKa = 10.34RR12 pKa = 11.84KK13 pKa = 9.1RR14 pKa = 11.84VHH16 pKa = 6.26GFRR19 pKa = 11.84ARR21 pKa = 11.84MATANGRR28 pKa = 11.84KK29 pKa = 8.91VLSRR33 pKa = 11.84RR34 pKa = 11.84RR35 pKa = 11.84AKK37 pKa = 10.44GRR39 pKa = 11.84ARR41 pKa = 11.84LSAA44 pKa = 3.91
Molecular weight: 5.11 kDa
Isoelectric point according different methods:
Peptides (in silico digests for buttom-up proteomics)
Below you can find in silico digests of the whole proteome with Trypsin, Chymotrypsin, Trypsin+LysC, LysN, ArgC proteases suitable for different mass spec machines.| Try ESI |
 |
|---|
| ChTry ESI |
|
|---|
| ArgC ESI |
|
|---|
| LysN ESI |
|
|---|
| TryLysC ESI |
|
|---|
| Try MALDI |
|
|---|
| ChTry MALDI |
|
|---|
| ArgC MALDI |
|
|---|
| LysN MALDI |
|
|---|
| TryLysC MALDI |
|
|---|
| Try LTQ |
|
|---|
| ChTry LTQ |
|
|---|
| ArgC LTQ |
|
|---|
| LysN LTQ |
|
|---|
| TryLysC LTQ |
|
|---|
| Try MSlow |
|
|---|
| ChTry MSlow |
|
|---|
| ArgC MSlow |
|
|---|
| LysN MSlow |
|
|---|
| TryLysC MSlow |
|
|---|
| Try MShigh |
|
|---|
| ChTry MShigh |
|
|---|
| ArgC MShigh |
|
|---|
| LysN MShigh |
|
|---|
| TryLysC MShigh |
|
|---|
General Statistics
Number of major isoforms |
Number of additional isoforms |
Number of all proteins |
Number of amino acids |
Min. Seq. Length |
Max. Seq. Length |
Avg. Seq. Length |
Avg. Mol. Weight |
|---|---|---|---|---|---|---|---|
0 |
1219654 |
16 |
2517 |
330.4 |
36.5 |
Amino acid frequency
Ala |
Cys |
Asp |
Glu |
Phe |
Gly |
His |
Ile |
Lys |
Leu |
|---|---|---|---|---|---|---|---|---|---|
9.665 ± 0.042 | 0.937 ± 0.013 |
5.994 ± 0.031 | 6.471 ± 0.04 |
3.8 ± 0.027 | 7.853 ± 0.039 |
2.243 ± 0.023 | 5.228 ± 0.029 |
3.675 ± 0.033 | 10.67 ± 0.058 |
Met |
Asn |
Gln |
Pro |
Arg |
Ser |
Thr |
Val |
Trp |
Tyr |
|---|---|---|---|---|---|---|---|---|---|
2.548 ± 0.018 | 3.193 ± 0.024 |
4.744 ± 0.021 | 3.94 ± 0.031 |
6.723 ± 0.039 | 5.933 ± 0.03 |
5.196 ± 0.027 | 7.25 ± 0.036 |
1.377 ± 0.017 | 2.561 ± 0.018 |
Most of the basic statistics you can see at this page can be downloaded from this CSV file
See this proteome in:

Proteome-pI is available under Creative Commons Attribution-NoDerivs license, for more details see here
| Reference: Kozlowski LP. Proteome-pI 2.0: Proteome Isoelectric Point Database Update. Nucleic Acids Res. 2021, doi: 10.1093/nar/gkab944 | Contact: Lukasz P. Kozlowski |