Lactobacillus phage JCL1032
Taxonomy: Viruses; Duplodnaviria; Heunggongvirae; Uroviricota; Caudoviricetes; Caudovirales; Siphoviridae; unclassified Siphoviridae
Average proteome isoelectric point is 6.57
Get precalculated fractions of proteins
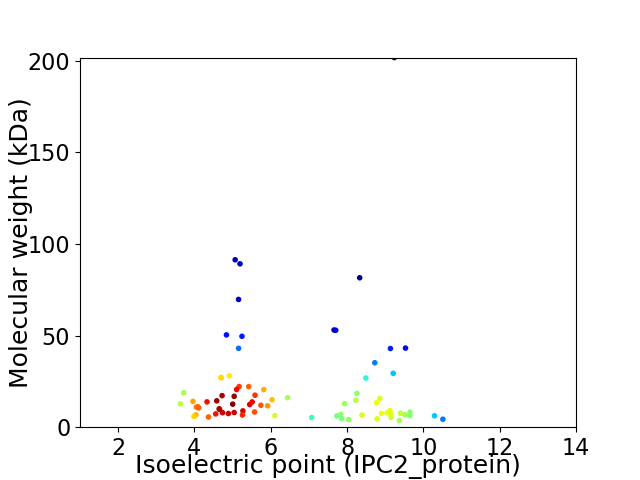
Virtual 2D-PAGE plot for 77 proteins (isoelectric point calculated using IPC2_protein)
Get csv file with sequences according to given criteria:
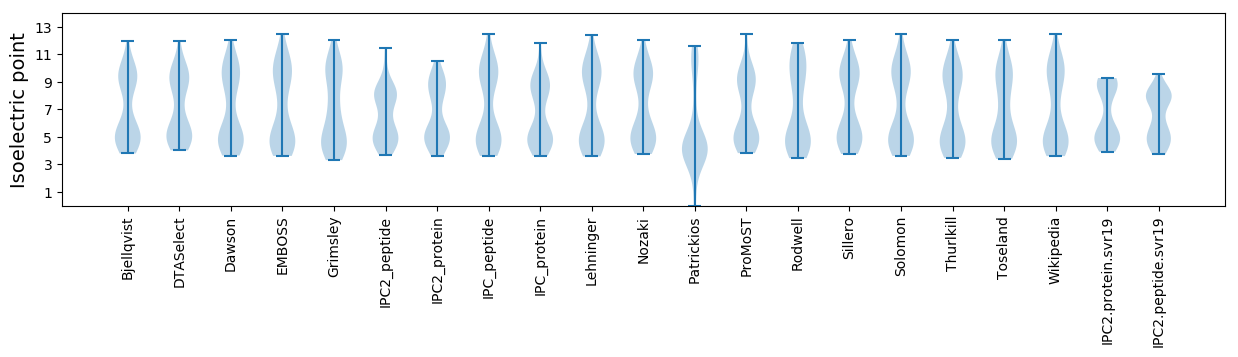
* You can choose from 21 different methods for calculating isoelectric point
Summary statistics related to proteome-wise predictions
Protein with the lowest isoelectric point:
>tr|F8J1E4|F8J1E4_9CAUD Uncharacterized protein OS=Lactobacillus phage JCL1032 OX=37105 PE=4 SV=1
MM1 pKa = 7.19NVIEE5 pKa = 4.54LHH7 pKa = 5.68PAEE10 pKa = 4.41NEE12 pKa = 3.91EE13 pKa = 4.09MDD15 pKa = 3.73EE16 pKa = 4.39MEE18 pKa = 4.85YY19 pKa = 10.69TPMNYY24 pKa = 9.03IMALLNPDD32 pKa = 4.03HH33 pKa = 7.06PPVVDD38 pKa = 3.54GRR40 pKa = 11.84EE41 pKa = 3.85MTDD44 pKa = 3.64YY45 pKa = 11.21EE46 pKa = 3.89ILEE49 pKa = 4.17YY50 pKa = 10.73LRR52 pKa = 11.84QCVYY56 pKa = 11.23
MM1 pKa = 7.19NVIEE5 pKa = 4.54LHH7 pKa = 5.68PAEE10 pKa = 4.41NEE12 pKa = 3.91EE13 pKa = 4.09MDD15 pKa = 3.73EE16 pKa = 4.39MEE18 pKa = 4.85YY19 pKa = 10.69TPMNYY24 pKa = 9.03IMALLNPDD32 pKa = 4.03HH33 pKa = 7.06PPVVDD38 pKa = 3.54GRR40 pKa = 11.84EE41 pKa = 3.85MTDD44 pKa = 3.64YY45 pKa = 11.21EE46 pKa = 3.89ILEE49 pKa = 4.17YY50 pKa = 10.73LRR52 pKa = 11.84QCVYY56 pKa = 11.23
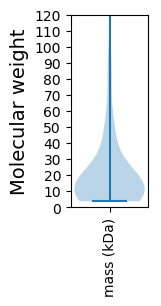
Molecular weight: 6.71 kDa
Isoelectric point according different methods:
Protein with the highest isoelectric point:
>tr|F8J1G4|F8J1G4_9CAUD Uncharacterized protein OS=Lactobacillus phage JCL1032 OX=37105 PE=4 SV=1
MM1 pKa = 7.55RR2 pKa = 11.84WNRR5 pKa = 11.84TSFQPKK11 pKa = 9.12HH12 pKa = 5.57NCNKK16 pKa = 10.45KK17 pKa = 9.92IMRR20 pKa = 11.84SSTKK24 pKa = 10.0FKK26 pKa = 10.94LQFTICCSRR35 pKa = 11.84LSTPITAMHH44 pKa = 7.24DD45 pKa = 3.38LGLAPSGSLWCRR57 pKa = 11.84VTT59 pKa = 3.61
MM1 pKa = 7.55RR2 pKa = 11.84WNRR5 pKa = 11.84TSFQPKK11 pKa = 9.12HH12 pKa = 5.57NCNKK16 pKa = 10.45KK17 pKa = 9.92IMRR20 pKa = 11.84SSTKK24 pKa = 10.0FKK26 pKa = 10.94LQFTICCSRR35 pKa = 11.84LSTPITAMHH44 pKa = 7.24DD45 pKa = 3.38LGLAPSGSLWCRR57 pKa = 11.84VTT59 pKa = 3.61
Molecular weight: 6.82 kDa
Isoelectric point according different methods:
Peptides (in silico digests for buttom-up proteomics)
Below you can find in silico digests of the whole proteome with Trypsin, Chymotrypsin, Trypsin+LysC, LysN, ArgC proteases suitable for different mass spec machines.| Try ESI |
 |
|---|
| ChTry ESI |
|
|---|
| ArgC ESI |
|
|---|
| LysN ESI |
|
|---|
| TryLysC ESI |
|
|---|
| Try MALDI |
|
|---|
| ChTry MALDI |
|
|---|
| ArgC MALDI |
|
|---|
| LysN MALDI |
|
|---|
| TryLysC MALDI |
|
|---|
| Try LTQ |
|
|---|
| ChTry LTQ |
|
|---|
| ArgC LTQ |
|
|---|
| LysN LTQ |
|
|---|
| TryLysC LTQ |
|
|---|
| Try MSlow |
|
|---|
| ChTry MSlow |
|
|---|
| ArgC MSlow |
|
|---|
| LysN MSlow |
|
|---|
| TryLysC MSlow |
|
|---|
| Try MShigh |
|
|---|
| ChTry MShigh |
|
|---|
| ArgC MShigh |
|
|---|
| LysN MShigh |
|
|---|
| TryLysC MShigh |
|
|---|
General Statistics
Number of major isoforms |
Number of additional isoforms |
Number of all proteins |
Number of amino acids |
Min. Seq. Length |
Max. Seq. Length |
Avg. Seq. Length |
Avg. Mol. Weight |
|---|---|---|---|---|---|---|---|
0 |
14870 |
32 |
1868 |
193.1 |
21.71 |
Amino acid frequency
Ala |
Cys |
Asp |
Glu |
Phe |
Gly |
His |
Ile |
Lys |
Leu |
|---|---|---|---|---|---|---|---|---|---|
7.814 ± 0.559 | 0.941 ± 0.186 |
6.597 ± 0.436 | 5.992 ± 0.349 |
3.712 ± 0.244 | 6.799 ± 0.415 |
1.923 ± 0.144 | 5.548 ± 0.217 |
8.016 ± 0.592 | 8.117 ± 0.32 |
Met |
Asn |
Gln |
Pro |
Arg |
Ser |
Thr |
Val |
Trp |
Tyr |
|---|---|---|---|---|---|---|---|---|---|
2.845 ± 0.154 | 5.185 ± 0.242 |
3.45 ± 0.275 | 3.927 ± 0.201 |
4.519 ± 0.252 | 6.564 ± 0.272 |
6.18 ± 0.284 | 6.301 ± 0.193 |
1.533 ± 0.125 | 4.035 ± 0.301 |
Most of the basic statistics you can see at this page can be downloaded from this CSV file
See this proteome in:

Proteome-pI is available under Creative Commons Attribution-NoDerivs license, for more details see here
| Reference: Kozlowski LP. Proteome-pI 2.0: Proteome Isoelectric Point Database Update. Nucleic Acids Res. 2021, doi: 10.1093/nar/gkab944 | Contact: Lukasz P. Kozlowski |