Bacillus phage vB_BpsM-61
Taxonomy: Viruses; Duplodnaviria; Heunggongvirae; Uroviricota; Caudoviricetes; Caudovirales; Siphoviridae; Saundersvirus; unclassified Saundersvirus
Average proteome isoelectric point is 6.59
Get precalculated fractions of proteins
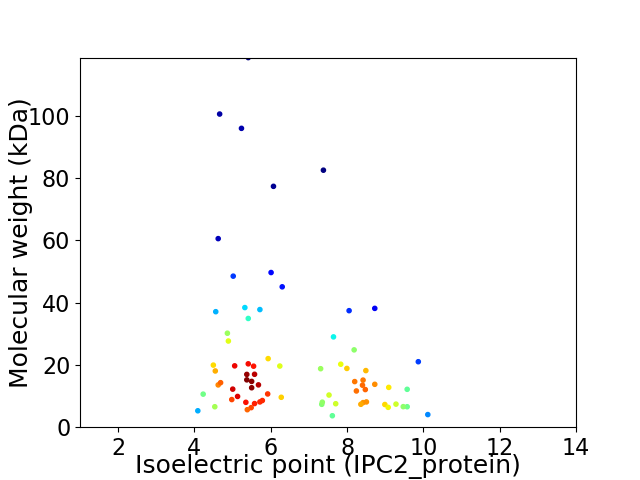
Virtual 2D-PAGE plot for 75 proteins (isoelectric point calculated using IPC2_protein)
Get csv file with sequences according to given criteria:
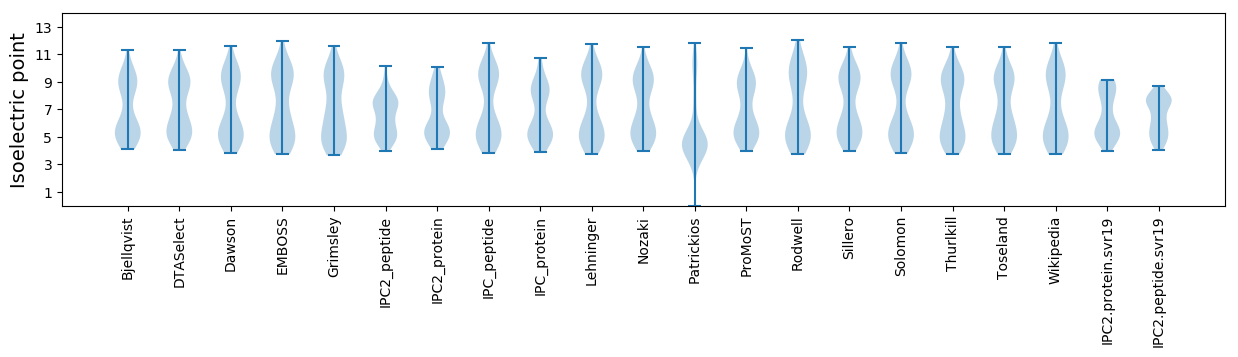
* You can choose from 21 different methods for calculating isoelectric point
Summary statistics related to proteome-wise predictions
Protein with the lowest isoelectric point:
>tr|A0A3G3BXB3|A0A3G3BXB3_9CAUD Uncharacterized protein OS=Bacillus phage vB_BpsM-61 OX=2419620 GN=BpsM61_00002 PE=4 SV=1
MM1 pKa = 8.4DD2 pKa = 4.57YY3 pKa = 10.94GDD5 pKa = 4.7KK6 pKa = 11.04VGEE9 pKa = 4.36CEE11 pKa = 4.04CCDD14 pKa = 4.05RR15 pKa = 11.84EE16 pKa = 4.48GTPIQYY22 pKa = 10.2SRR24 pKa = 11.84YY25 pKa = 9.11FIGWLCEE32 pKa = 4.07NCWEE36 pKa = 4.66SIAEE40 pKa = 4.16SVISGEE46 pKa = 4.04
MM1 pKa = 8.4DD2 pKa = 4.57YY3 pKa = 10.94GDD5 pKa = 4.7KK6 pKa = 11.04VGEE9 pKa = 4.36CEE11 pKa = 4.04CCDD14 pKa = 4.05RR15 pKa = 11.84EE16 pKa = 4.48GTPIQYY22 pKa = 10.2SRR24 pKa = 11.84YY25 pKa = 9.11FIGWLCEE32 pKa = 4.07NCWEE36 pKa = 4.66SIAEE40 pKa = 4.16SVISGEE46 pKa = 4.04
Molecular weight: 5.27 kDa
Isoelectric point according different methods:
Protein with the highest isoelectric point:
>tr|A0A3G3BY10|A0A3G3BY10_9CAUD Uncharacterized protein OS=Bacillus phage vB_BpsM-61 OX=2419620 GN=BpsM61_00047 PE=4 SV=1
MM1 pKa = 7.67GKK3 pKa = 9.47PSKK6 pKa = 9.8GTPKK10 pKa = 10.87DD11 pKa = 3.35MRR13 pKa = 11.84LKK15 pKa = 10.34EE16 pKa = 4.15NKK18 pKa = 9.57KK19 pKa = 10.33LRR21 pKa = 11.84GPSKK25 pKa = 10.08RR26 pKa = 11.84SPGAASTKK34 pKa = 9.9KK35 pKa = 10.44KK36 pKa = 10.33KK37 pKa = 10.41
MM1 pKa = 7.67GKK3 pKa = 9.47PSKK6 pKa = 9.8GTPKK10 pKa = 10.87DD11 pKa = 3.35MRR13 pKa = 11.84LKK15 pKa = 10.34EE16 pKa = 4.15NKK18 pKa = 9.57KK19 pKa = 10.33LRR21 pKa = 11.84GPSKK25 pKa = 10.08RR26 pKa = 11.84SPGAASTKK34 pKa = 9.9KK35 pKa = 10.44KK36 pKa = 10.33KK37 pKa = 10.41
Molecular weight: 4.05 kDa
Isoelectric point according different methods:
Peptides (in silico digests for buttom-up proteomics)
Below you can find in silico digests of the whole proteome with Trypsin, Chymotrypsin, Trypsin+LysC, LysN, ArgC proteases suitable for different mass spec machines.| Try ESI |
 |
|---|
| ChTry ESI |
|
|---|
| ArgC ESI |
|
|---|
| LysN ESI |
|
|---|
| TryLysC ESI |
|
|---|
| Try MALDI |
|
|---|
| ChTry MALDI |
|
|---|
| ArgC MALDI |
|
|---|
| LysN MALDI |
|
|---|
| TryLysC MALDI |
|
|---|
| Try LTQ |
|
|---|
| ChTry LTQ |
|
|---|
| ArgC LTQ |
|
|---|
| LysN LTQ |
|
|---|
| TryLysC LTQ |
|
|---|
| Try MSlow |
|
|---|
| ChTry MSlow |
|
|---|
| ArgC MSlow |
|
|---|
| LysN MSlow |
|
|---|
| TryLysC MSlow |
|
|---|
| Try MShigh |
|
|---|
| ChTry MShigh |
|
|---|
| ArgC MShigh |
|
|---|
| LysN MShigh |
|
|---|
| TryLysC MShigh |
|
|---|
General Statistics
Number of major isoforms |
Number of additional isoforms |
Number of all proteins |
Number of amino acids |
Min. Seq. Length |
Max. Seq. Length |
Avg. Seq. Length |
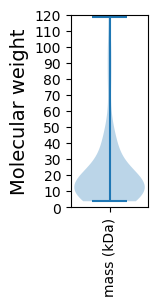
Avg. Mol. Weight |
|---|---|---|---|---|---|---|---|
0 |
14855 |
32 |
1040 |
198.1 |
22.54 |
Amino acid frequency
Ala |
Cys |
Asp |
Glu |
Phe |
Gly |
His |
Ile |
Lys |
Leu |
|---|---|---|---|---|---|---|---|---|---|
5.412 ± 0.384 | 0.545 ± 0.104 |
6.94 ± 0.261 | 7.506 ± 0.431 |
3.601 ± 0.169 | 7.412 ± 0.24 |
2.067 ± 0.191 | 7.156 ± 0.293 |
7.486 ± 0.466 | 6.738 ± 0.214 |
Met |
Asn |
Gln |
Pro |
Arg |
Ser |
Thr |
Val |
Trp |
Tyr |
|---|---|---|---|---|---|---|---|---|---|
3.669 ± 0.172 | 5.136 ± 0.213 |
3.568 ± 0.203 | 4.012 ± 0.158 |
5.5 ± 0.211 | 6.038 ± 0.212 |
5.816 ± 0.241 | 6.254 ± 0.222 |
1.508 ± 0.114 | 3.635 ± 0.215 |
Most of the basic statistics you can see at this page can be downloaded from this CSV file
See this proteome in:

Proteome-pI is available under Creative Commons Attribution-NoDerivs license, for more details see here
| Reference: Kozlowski LP. Proteome-pI 2.0: Proteome Isoelectric Point Database Update. Nucleic Acids Res. 2021, doi: 10.1093/nar/gkab944 | Contact: Lukasz P. Kozlowski |