Sphingomonas sp. WG
Taxonomy: cellular organisms; Bacteria; Proteobacteria; Alphaproteobacteria; Sphingomonadales; Sphingomonadaceae; Sphingomonas; unclassified Sphingomonas
Average proteome isoelectric point is 6.7
Get precalculated fractions of proteins
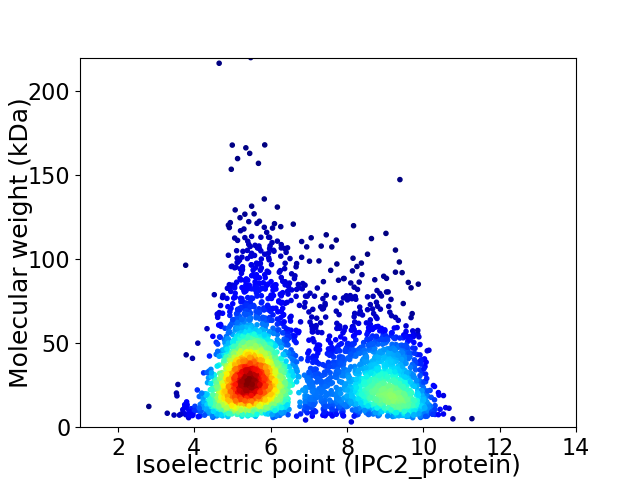
Virtual 2D-PAGE plot for 3630 proteins (isoelectric point calculated using IPC2_protein)
Get csv file with sequences according to given criteria:
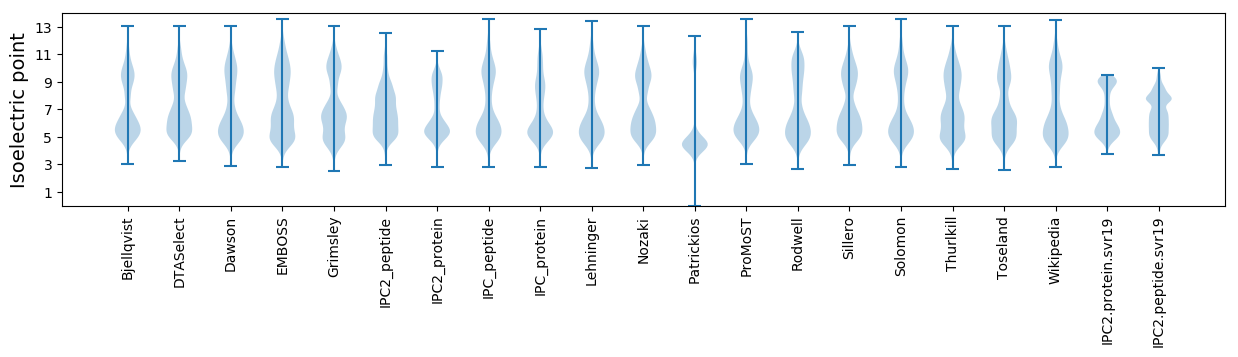
* You can choose from 21 different methods for calculating isoelectric point
Summary statistics related to proteome-wise predictions
Protein with the lowest isoelectric point:
>tr|A0A0W1QQH9|A0A0W1QQH9_9SPHN Uncharacterized protein OS=Sphingomonas sp. WG OX=1592629 GN=ATB93_00285 PE=4 SV=1
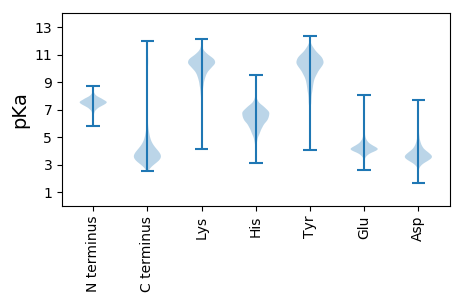
MM1 pKa = 7.9GDD3 pKa = 3.14QILNYY8 pKa = 8.74RR9 pKa = 11.84ACGAEE14 pKa = 4.34CRR16 pKa = 11.84EE17 pKa = 3.95DD18 pKa = 3.64WLRR21 pKa = 11.84MLACDD26 pKa = 4.68DD27 pKa = 4.06GLPFEE32 pKa = 4.71SVRR35 pKa = 11.84DD36 pKa = 3.37AAEE39 pKa = 3.94RR40 pKa = 11.84FGEE43 pKa = 4.5AEE45 pKa = 4.72DD46 pKa = 4.22FEE48 pKa = 4.64QLIDD52 pKa = 3.63YY53 pKa = 10.85CEE55 pKa = 4.73GGGSALQQ62 pKa = 3.5
MM1 pKa = 7.9GDD3 pKa = 3.14QILNYY8 pKa = 8.74RR9 pKa = 11.84ACGAEE14 pKa = 4.34CRR16 pKa = 11.84EE17 pKa = 3.95DD18 pKa = 3.64WLRR21 pKa = 11.84MLACDD26 pKa = 4.68DD27 pKa = 4.06GLPFEE32 pKa = 4.71SVRR35 pKa = 11.84DD36 pKa = 3.37AAEE39 pKa = 3.94RR40 pKa = 11.84FGEE43 pKa = 4.5AEE45 pKa = 4.72DD46 pKa = 4.22FEE48 pKa = 4.64QLIDD52 pKa = 3.63YY53 pKa = 10.85CEE55 pKa = 4.73GGGSALQQ62 pKa = 3.5
Molecular weight: 6.94 kDa
Isoelectric point according different methods:
Protein with the highest isoelectric point:
>tr|A0A0W1QGJ8|A0A0W1QGJ8_9SPHN Uncharacterized protein OS=Sphingomonas sp. WG OX=1592629 GN=ATB93_02670 PE=4 SV=1
MM1 pKa = 7.45KK2 pKa = 9.61RR3 pKa = 11.84TFQPSNLVRR12 pKa = 11.84ARR14 pKa = 11.84RR15 pKa = 11.84HH16 pKa = 4.37GFRR19 pKa = 11.84ARR21 pKa = 11.84MATPGGRR28 pKa = 11.84NVIRR32 pKa = 11.84ARR34 pKa = 11.84RR35 pKa = 11.84ARR37 pKa = 11.84GRR39 pKa = 11.84KK40 pKa = 9.02KK41 pKa = 10.61LSAA44 pKa = 4.03
MM1 pKa = 7.45KK2 pKa = 9.61RR3 pKa = 11.84TFQPSNLVRR12 pKa = 11.84ARR14 pKa = 11.84RR15 pKa = 11.84HH16 pKa = 4.37GFRR19 pKa = 11.84ARR21 pKa = 11.84MATPGGRR28 pKa = 11.84NVIRR32 pKa = 11.84ARR34 pKa = 11.84RR35 pKa = 11.84ARR37 pKa = 11.84GRR39 pKa = 11.84KK40 pKa = 9.02KK41 pKa = 10.61LSAA44 pKa = 4.03
Molecular weight: 5.09 kDa
Isoelectric point according different methods:
Peptides (in silico digests for buttom-up proteomics)
Below you can find in silico digests of the whole proteome with Trypsin, Chymotrypsin, Trypsin+LysC, LysN, ArgC proteases suitable for different mass spec machines.| Try ESI |
 |
|---|
| ChTry ESI |
|
|---|
| ArgC ESI |
|
|---|
| LysN ESI |
|
|---|
| TryLysC ESI |
|
|---|
| Try MALDI |
|
|---|
| ChTry MALDI |
|
|---|
| ArgC MALDI |
|
|---|
| LysN MALDI |
|
|---|
| TryLysC MALDI |
|
|---|
| Try LTQ |
|
|---|
| ChTry LTQ |
|
|---|
| ArgC LTQ |
|
|---|
| LysN LTQ |
|
|---|
| TryLysC LTQ |
|
|---|
| Try MSlow |
|
|---|
| ChTry MSlow |
|
|---|
| ArgC MSlow |
|
|---|
| LysN MSlow |
|
|---|
| TryLysC MSlow |
|
|---|
| Try MShigh |
|
|---|
| ChTry MShigh |
|
|---|
| ArgC MShigh |
|
|---|
| LysN MShigh |
|
|---|
| TryLysC MShigh |
|
|---|
General Statistics
Number of major isoforms |
Number of additional isoforms |
Number of all proteins |
Number of amino acids |
Min. Seq. Length |
Max. Seq. Length |
Avg. Seq. Length |
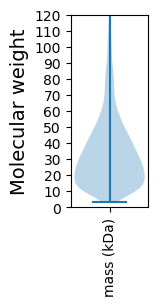
Avg. Mol. Weight |
|---|---|---|---|---|---|---|---|
0 |
1189672 |
29 |
2191 |
327.7 |
35.33 |
Amino acid frequency
Ala |
Cys |
Asp |
Glu |
Phe |
Gly |
His |
Ile |
Lys |
Leu |
|---|---|---|---|---|---|---|---|---|---|
13.906 ± 0.062 | 0.715 ± 0.013 |
5.744 ± 0.027 | 5.194 ± 0.041 |
3.538 ± 0.023 | 8.99 ± 0.039 |
1.943 ± 0.02 | 4.736 ± 0.023 |
2.72 ± 0.028 | 10.109 ± 0.048 |
Met |
Asn |
Gln |
Pro |
Arg |
Ser |
Thr |
Val |
Trp |
Tyr |
|---|---|---|---|---|---|---|---|---|---|
2.27 ± 0.019 | 2.509 ± 0.028 |
5.45 ± 0.029 | 3.248 ± 0.023 |
7.583 ± 0.043 | 5.009 ± 0.029 |
5.384 ± 0.034 | 7.25 ± 0.031 |
1.478 ± 0.019 | 2.225 ± 0.023 |
Most of the basic statistics you can see at this page can be downloaded from this CSV file
See this proteome in:

Proteome-pI is available under Creative Commons Attribution-NoDerivs license, for more details see here
| Reference: Kozlowski LP. Proteome-pI 2.0: Proteome Isoelectric Point Database Update. Nucleic Acids Res. 2021, doi: 10.1093/nar/gkab944 | Contact: Lukasz P. Kozlowski |