Caballeronia insecticola
Taxonomy: cellular organisms; Bacteria; Proteobacteria; Betaproteobacteria; Burkholderiales; Burkholderiaceae; Caballeronia
Average proteome isoelectric point is 6.81
Get precalculated fractions of proteins
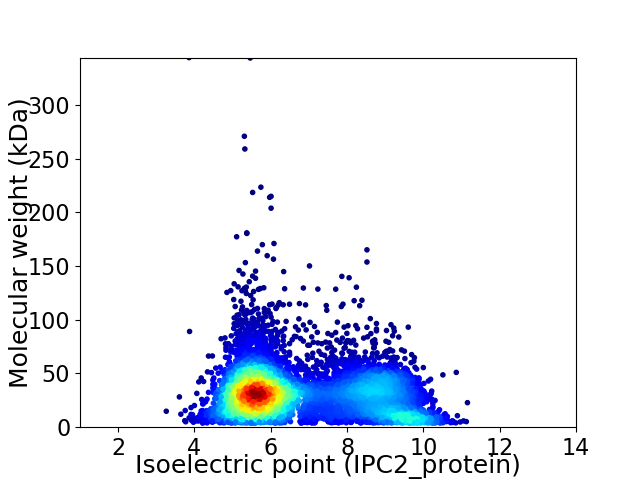
Virtual 2D-PAGE plot for 6724 proteins (isoelectric point calculated using IPC2_protein)
Get csv file with sequences according to given criteria:
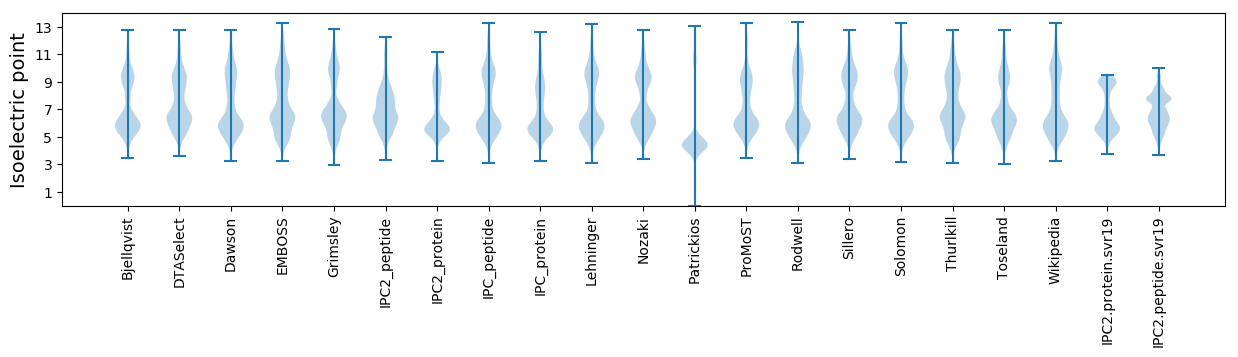
* You can choose from 21 different methods for calculating isoelectric point
Summary statistics related to proteome-wise predictions
Protein with the lowest isoelectric point:
>tr|R4WGJ1|R4WGJ1_9BURK LexA repressor OS=Caballeronia insecticola OX=758793 GN=lexA PE=3 SV=1
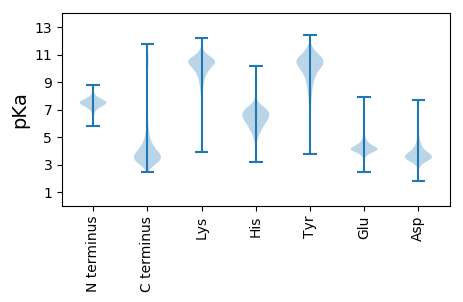
MM1 pKa = 7.66SEE3 pKa = 4.05VIEE6 pKa = 4.22YY7 pKa = 10.35KK8 pKa = 10.44SWVCLICGWIYY19 pKa = 11.0NEE21 pKa = 4.11EE22 pKa = 4.61DD23 pKa = 3.62GLPEE27 pKa = 5.29DD28 pKa = 5.57GIAAGTRR35 pKa = 11.84FGEE38 pKa = 4.66IPDD41 pKa = 3.74DD42 pKa = 3.9WRR44 pKa = 11.84CPLCDD49 pKa = 3.13VGKK52 pKa = 10.52ADD54 pKa = 3.73FVVVEE59 pKa = 5.07FF60 pKa = 4.82
MM1 pKa = 7.66SEE3 pKa = 4.05VIEE6 pKa = 4.22YY7 pKa = 10.35KK8 pKa = 10.44SWVCLICGWIYY19 pKa = 11.0NEE21 pKa = 4.11EE22 pKa = 4.61DD23 pKa = 3.62GLPEE27 pKa = 5.29DD28 pKa = 5.57GIAAGTRR35 pKa = 11.84FGEE38 pKa = 4.66IPDD41 pKa = 3.74DD42 pKa = 3.9WRR44 pKa = 11.84CPLCDD49 pKa = 3.13VGKK52 pKa = 10.52ADD54 pKa = 3.73FVVVEE59 pKa = 5.07FF60 pKa = 4.82
Molecular weight: 6.79 kDa
Isoelectric point according different methods:
Protein with the highest isoelectric point:
>tr|R4WPK3|R4WPK3_9BURK Uncharacterized protein OS=Caballeronia insecticola OX=758793 GN=BRPE64_ACDS10310 PE=4 SV=1
MM1 pKa = 7.67KK2 pKa = 10.35KK3 pKa = 10.29NPFLSMWLSGANAVVGSTRR22 pKa = 11.84GRR24 pKa = 11.84ATAQAKK30 pKa = 9.51RR31 pKa = 11.84QVSNFWSAALAPSKK45 pKa = 9.92PKK47 pKa = 10.11KK48 pKa = 9.61RR49 pKa = 11.84RR50 pKa = 11.84ARR52 pKa = 11.84RR53 pKa = 3.28
MM1 pKa = 7.67KK2 pKa = 10.35KK3 pKa = 10.29NPFLSMWLSGANAVVGSTRR22 pKa = 11.84GRR24 pKa = 11.84ATAQAKK30 pKa = 9.51RR31 pKa = 11.84QVSNFWSAALAPSKK45 pKa = 9.92PKK47 pKa = 10.11KK48 pKa = 9.61RR49 pKa = 11.84RR50 pKa = 11.84ARR52 pKa = 11.84RR53 pKa = 3.28
Molecular weight: 5.87 kDa
Isoelectric point according different methods:
Peptides (in silico digests for buttom-up proteomics)
Below you can find in silico digests of the whole proteome with Trypsin, Chymotrypsin, Trypsin+LysC, LysN, ArgC proteases suitable for different mass spec machines.| Try ESI |
 |
|---|
| ChTry ESI |
|
|---|
| ArgC ESI |
|
|---|
| LysN ESI |
|
|---|
| TryLysC ESI |
|
|---|
| Try MALDI |
|
|---|
| ChTry MALDI |
|
|---|
| ArgC MALDI |
|
|---|
| LysN MALDI |
|
|---|
| TryLysC MALDI |
|
|---|
| Try LTQ |
|
|---|
| ChTry LTQ |
|
|---|
| ArgC LTQ |
|
|---|
| LysN LTQ |
|
|---|
| TryLysC LTQ |
|
|---|
| Try MSlow |
|
|---|
| ChTry MSlow |
|
|---|
| ArgC MSlow |
|
|---|
| LysN MSlow |
|
|---|
| TryLysC MSlow |
|
|---|
| Try MShigh |
|
|---|
| ChTry MShigh |
|
|---|
| ArgC MShigh |
|
|---|
| LysN MShigh |
|
|---|
| TryLysC MShigh |
|
|---|
General Statistics
Number of major isoforms |
Number of additional isoforms |
Number of all proteins |
Number of amino acids |
Min. Seq. Length |
Max. Seq. Length |
Avg. Seq. Length |
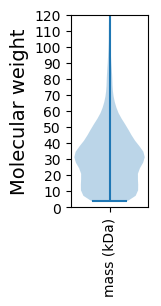
Avg. Mol. Weight |
|---|---|---|---|---|---|---|---|
0 |
2040670 |
37 |
3414 |
303.5 |
32.98 |
Amino acid frequency
Ala |
Cys |
Asp |
Glu |
Phe |
Gly |
His |
Ile |
Lys |
Leu |
|---|---|---|---|---|---|---|---|---|---|
12.856 ± 0.048 | 0.947 ± 0.009 |
5.551 ± 0.024 | 5.163 ± 0.029 |
3.822 ± 0.019 | 8.052 ± 0.03 |
2.346 ± 0.016 | 4.918 ± 0.021 |
3.231 ± 0.028 | 10.01 ± 0.035 |
Met |
Asn |
Gln |
Pro |
Arg |
Ser |
Thr |
Val |
Trp |
Tyr |
|---|---|---|---|---|---|---|---|---|---|
2.512 ± 0.016 | 2.811 ± 0.018 |
4.983 ± 0.022 | 3.411 ± 0.018 |
7.032 ± 0.033 | 5.673 ± 0.024 |
5.339 ± 0.023 | 7.615 ± 0.024 |
1.34 ± 0.012 | 2.386 ± 0.015 |
Most of the basic statistics you can see at this page can be downloaded from this CSV file
See this proteome in:

Proteome-pI is available under Creative Commons Attribution-NoDerivs license, for more details see here
| Reference: Kozlowski LP. Proteome-pI 2.0: Proteome Isoelectric Point Database Update. Nucleic Acids Res. 2021, doi: 10.1093/nar/gkab944 | Contact: Lukasz P. Kozlowski |