Streptococcus phage phiJH1301-1
Taxonomy: Viruses; Duplodnaviria; Heunggongvirae; Uroviricota; Caudoviricetes; Caudovirales; Siphoviridae; unclassified Siphoviridae
Average proteome isoelectric point is 6.55
Get precalculated fractions of proteins
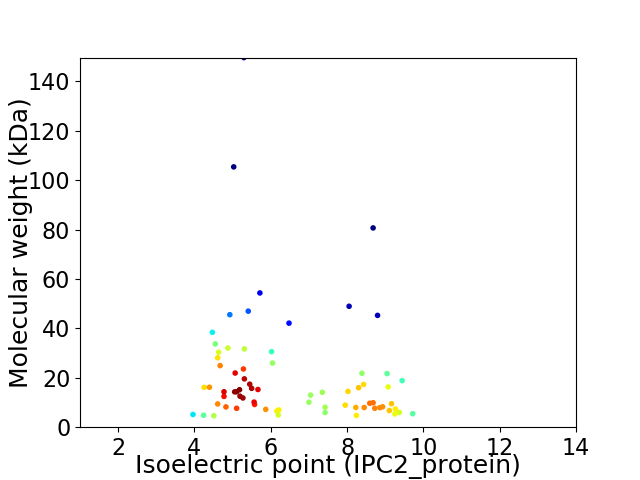
Virtual 2D-PAGE plot for 72 proteins (isoelectric point calculated using IPC2_protein)
Get csv file with sequences according to given criteria:
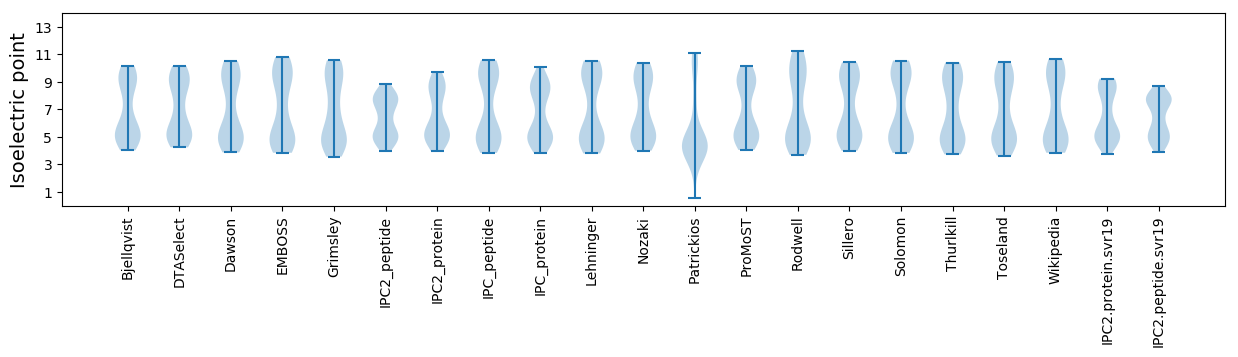
* You can choose from 21 different methods for calculating isoelectric point
Summary statistics related to proteome-wise predictions
Protein with the lowest isoelectric point:
>tr|A0A1X9I6I5|A0A1X9I6I5_9CAUD Uncharacterized protein OS=Streptococcus phage phiJH1301-1 OX=1860179 PE=4 SV=1
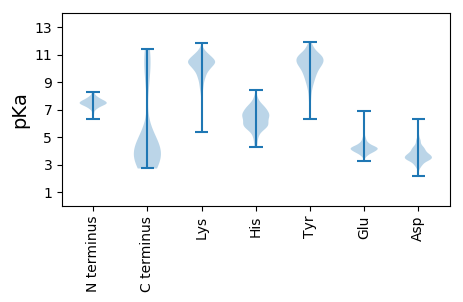
MM1 pKa = 7.68EE2 pKa = 4.49GTYY5 pKa = 10.23PWFDD9 pKa = 3.49YY10 pKa = 11.19DD11 pKa = 5.36RR12 pKa = 11.84DD13 pKa = 3.88YY14 pKa = 11.48LQPDD18 pKa = 4.07EE19 pKa = 4.78PRR21 pKa = 11.84QVHH24 pKa = 7.25DD25 pKa = 3.72PDD27 pKa = 2.99EE28 pKa = 4.13WVFRR32 pKa = 11.84GGQWIYY38 pKa = 11.49VGDD41 pKa = 3.78AA42 pKa = 3.3
MM1 pKa = 7.68EE2 pKa = 4.49GTYY5 pKa = 10.23PWFDD9 pKa = 3.49YY10 pKa = 11.19DD11 pKa = 5.36RR12 pKa = 11.84DD13 pKa = 3.88YY14 pKa = 11.48LQPDD18 pKa = 4.07EE19 pKa = 4.78PRR21 pKa = 11.84QVHH24 pKa = 7.25DD25 pKa = 3.72PDD27 pKa = 2.99EE28 pKa = 4.13WVFRR32 pKa = 11.84GGQWIYY38 pKa = 11.49VGDD41 pKa = 3.78AA42 pKa = 3.3
Molecular weight: 5.15 kDa
Isoelectric point according different methods:
Protein with the highest isoelectric point:
>tr|A0A1X9I676|A0A1X9I676_9CAUD Uncharacterized protein OS=Streptococcus phage phiJH1301-1 OX=1860179 PE=4 SV=1
MM1 pKa = 7.14KK2 pKa = 10.36QLLRR6 pKa = 11.84SFGFILIIYY15 pKa = 7.68LFVPNAIRR23 pKa = 11.84EE24 pKa = 4.04MTLAQKK30 pKa = 10.62IMFGLGASWLFYY42 pKa = 10.71EE43 pKa = 5.55GGRR46 pKa = 11.84KK47 pKa = 8.72
MM1 pKa = 7.14KK2 pKa = 10.36QLLRR6 pKa = 11.84SFGFILIIYY15 pKa = 7.68LFVPNAIRR23 pKa = 11.84EE24 pKa = 4.04MTLAQKK30 pKa = 10.62IMFGLGASWLFYY42 pKa = 10.71EE43 pKa = 5.55GGRR46 pKa = 11.84KK47 pKa = 8.72
Molecular weight: 5.47 kDa
Isoelectric point according different methods:
Peptides (in silico digests for buttom-up proteomics)
Below you can find in silico digests of the whole proteome with Trypsin, Chymotrypsin, Trypsin+LysC, LysN, ArgC proteases suitable for different mass spec machines.| Try ESI |
 |
|---|
| ChTry ESI |
|
|---|
| ArgC ESI |
|
|---|
| LysN ESI |
|
|---|
| TryLysC ESI |
|
|---|
| Try MALDI |
|
|---|
| ChTry MALDI |
|
|---|
| ArgC MALDI |
|
|---|
| LysN MALDI |
|
|---|
| TryLysC MALDI |
|
|---|
| Try LTQ |
|
|---|
| ChTry LTQ |
|
|---|
| ArgC LTQ |
|
|---|
| LysN LTQ |
|
|---|
| TryLysC LTQ |
|
|---|
| Try MSlow |
|
|---|
| ChTry MSlow |
|
|---|
| ArgC MSlow |
|
|---|
| LysN MSlow |
|
|---|
| TryLysC MSlow |
|
|---|
| Try MShigh |
|
|---|
| ChTry MShigh |
|
|---|
| ArgC MShigh |
|
|---|
| LysN MShigh |
|
|---|
| TryLysC MShigh |
|
|---|
General Statistics
Number of major isoforms |
Number of additional isoforms |
Number of all proteins |
Number of amino acids |
Min. Seq. Length |
Max. Seq. Length |
Avg. Seq. Length |
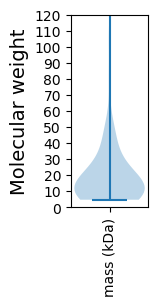
Avg. Mol. Weight |
|---|---|---|---|---|---|---|---|
0 |
13386 |
41 |
1353 |
185.9 |
20.99 |
Amino acid frequency
Ala |
Cys |
Asp |
Glu |
Phe |
Gly |
His |
Ile |
Lys |
Leu |
|---|---|---|---|---|---|---|---|---|---|
7.388 ± 0.283 | 0.583 ± 0.106 |
6.26 ± 0.228 | 7.695 ± 0.517 |
3.922 ± 0.327 | 6.679 ± 0.483 |
1.367 ± 0.131 | 6.679 ± 0.212 |
7.822 ± 0.366 | 8.098 ± 0.243 |
Met |
Asn |
Gln |
Pro |
Arg |
Ser |
Thr |
Val |
Trp |
Tyr |
|---|---|---|---|---|---|---|---|---|---|
2.211 ± 0.163 | 5.095 ± 0.218 |
3.048 ± 0.18 | 4.049 ± 0.158 |
4.863 ± 0.309 | 5.902 ± 0.341 |
6.223 ± 0.279 | 6.821 ± 0.224 |
1.412 ± 0.15 | 3.885 ± 0.298 |
Most of the basic statistics you can see at this page can be downloaded from this CSV file
See this proteome in:

Proteome-pI is available under Creative Commons Attribution-NoDerivs license, for more details see here
| Reference: Kozlowski LP. Proteome-pI 2.0: Proteome Isoelectric Point Database Update. Nucleic Acids Res. 2021, doi: 10.1093/nar/gkab944 | Contact: Lukasz P. Kozlowski |