Dyella sp. M7H15-1
Taxonomy: cellular organisms; Bacteria; Proteobacteria; Gammaproteobacteria; Xanthomonadales; Rhodanobacteraceae; Dyella; unclassified Dyella
Average proteome isoelectric point is 6.64
Get precalculated fractions of proteins
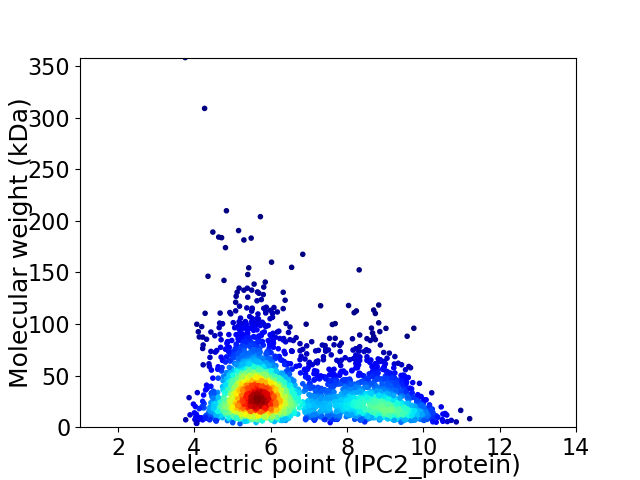
Virtual 2D-PAGE plot for 2958 proteins (isoelectric point calculated using IPC2_protein)
Get csv file with sequences according to given criteria:
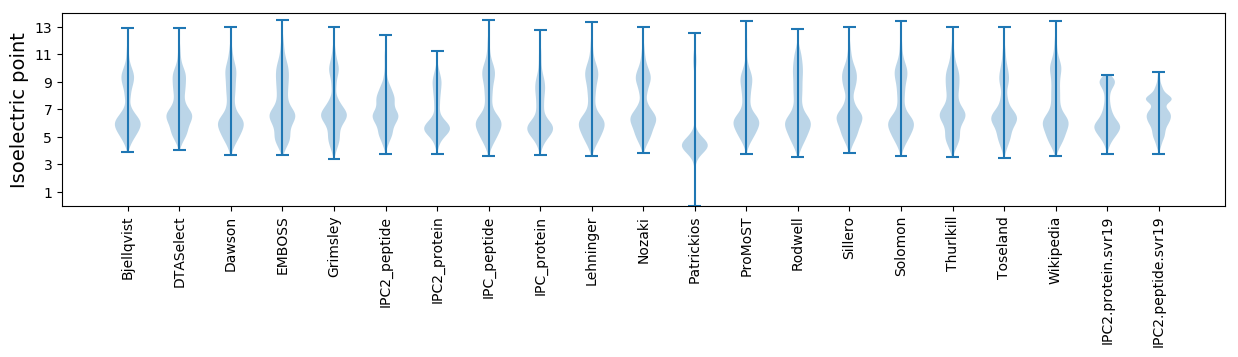
* You can choose from 21 different methods for calculating isoelectric point
Summary statistics related to proteome-wise predictions
Protein with the lowest isoelectric point:
>tr|A0A410UIR5|A0A410UIR5_9GAMM Protein TonB OS=Dyella sp. M7H15-1 OX=2501295 GN=EO087_08650 PE=3 SV=1
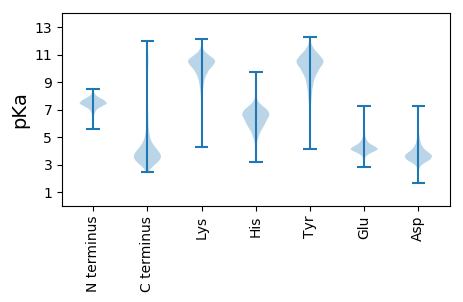
MM1 pKa = 7.18NQTSTDD7 pKa = 3.16TALRR11 pKa = 11.84KK12 pKa = 8.71WMCVVCGFIYY22 pKa = 10.61EE23 pKa = 4.29EE24 pKa = 4.11ALGLPEE30 pKa = 4.9EE31 pKa = 5.39GIDD34 pKa = 4.6PGTRR38 pKa = 11.84WSDD41 pKa = 3.73VPDD44 pKa = 2.97TWTCPDD50 pKa = 3.84CGATKK55 pKa = 10.7DD56 pKa = 3.88DD57 pKa = 4.33FEE59 pKa = 5.12MIEE62 pKa = 3.83IDD64 pKa = 3.43
MM1 pKa = 7.18NQTSTDD7 pKa = 3.16TALRR11 pKa = 11.84KK12 pKa = 8.71WMCVVCGFIYY22 pKa = 10.61EE23 pKa = 4.29EE24 pKa = 4.11ALGLPEE30 pKa = 4.9EE31 pKa = 5.39GIDD34 pKa = 4.6PGTRR38 pKa = 11.84WSDD41 pKa = 3.73VPDD44 pKa = 2.97TWTCPDD50 pKa = 3.84CGATKK55 pKa = 10.7DD56 pKa = 3.88DD57 pKa = 4.33FEE59 pKa = 5.12MIEE62 pKa = 3.83IDD64 pKa = 3.43
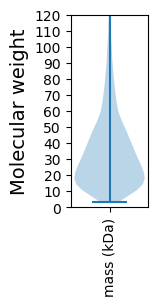
Molecular weight: 7.21 kDa
Isoelectric point according different methods:
Protein with the highest isoelectric point:
>tr|A0A410UKS2|A0A410UKS2_9GAMM Histidine kinase OS=Dyella sp. M7H15-1 OX=2501295 GN=EO087_13255 PE=4 SV=1
MM1 pKa = 6.48TRR3 pKa = 11.84RR4 pKa = 11.84RR5 pKa = 11.84KK6 pKa = 9.99GIPGLSFSWKK16 pKa = 8.18RR17 pKa = 11.84AVGISSAKK25 pKa = 10.39ANVSRR30 pKa = 11.84KK31 pKa = 9.58IGIPLTRR38 pKa = 11.84SGRR41 pKa = 11.84RR42 pKa = 11.84QRR44 pKa = 11.84MRR46 pKa = 11.84KK47 pKa = 9.57AKK49 pKa = 8.82GTLLTFIVGLFLVWMFVHH67 pKa = 7.17WLSQLL72 pKa = 3.39
MM1 pKa = 6.48TRR3 pKa = 11.84RR4 pKa = 11.84RR5 pKa = 11.84KK6 pKa = 9.99GIPGLSFSWKK16 pKa = 8.18RR17 pKa = 11.84AVGISSAKK25 pKa = 10.39ANVSRR30 pKa = 11.84KK31 pKa = 9.58IGIPLTRR38 pKa = 11.84SGRR41 pKa = 11.84RR42 pKa = 11.84QRR44 pKa = 11.84MRR46 pKa = 11.84KK47 pKa = 9.57AKK49 pKa = 8.82GTLLTFIVGLFLVWMFVHH67 pKa = 7.17WLSQLL72 pKa = 3.39
Molecular weight: 8.26 kDa
Isoelectric point according different methods:
Peptides (in silico digests for buttom-up proteomics)
Below you can find in silico digests of the whole proteome with Trypsin, Chymotrypsin, Trypsin+LysC, LysN, ArgC proteases suitable for different mass spec machines.| Try ESI |
 |
|---|
| ChTry ESI |
|
|---|
| ArgC ESI |
|
|---|
| LysN ESI |
|
|---|
| TryLysC ESI |
|
|---|
| Try MALDI |
|
|---|
| ChTry MALDI |
|
|---|
| ArgC MALDI |
|
|---|
| LysN MALDI |
|
|---|
| TryLysC MALDI |
|
|---|
| Try LTQ |
|
|---|
| ChTry LTQ |
|
|---|
| ArgC LTQ |
|
|---|
| LysN LTQ |
|
|---|
| TryLysC LTQ |
|
|---|
| Try MSlow |
|
|---|
| ChTry MSlow |
|
|---|
| ArgC MSlow |
|
|---|
| LysN MSlow |
|
|---|
| TryLysC MSlow |
|
|---|
| Try MShigh |
|
|---|
| ChTry MShigh |
|
|---|
| ArgC MShigh |
|
|---|
| LysN MShigh |
|
|---|
| TryLysC MShigh |
|
|---|
General Statistics
Number of major isoforms |
Number of additional isoforms |
Number of all proteins |
Number of amino acids |
Min. Seq. Length |
Max. Seq. Length |
Avg. Seq. Length |
Avg. Mol. Weight |
|---|---|---|---|---|---|---|---|
0 |
982631 |
30 |
3789 |
332.2 |
36.3 |
Amino acid frequency
Ala |
Cys |
Asp |
Glu |
Phe |
Gly |
His |
Ile |
Lys |
Leu |
|---|---|---|---|---|---|---|---|---|---|
11.282 ± 0.06 | 0.93 ± 0.014 |
5.603 ± 0.034 | 5.076 ± 0.057 |
3.376 ± 0.029 | 8.096 ± 0.059 |
2.665 ± 0.024 | 4.818 ± 0.034 |
3.37 ± 0.043 | 10.5 ± 0.06 |
Met |
Asn |
Gln |
Pro |
Arg |
Ser |
Thr |
Val |
Trp |
Tyr |
|---|---|---|---|---|---|---|---|---|---|
2.468 ± 0.021 | 3.284 ± 0.047 |
5.013 ± 0.037 | 4.153 ± 0.029 |
6.513 ± 0.064 | 5.921 ± 0.046 |
5.573 ± 0.056 | 7.292 ± 0.039 |
1.438 ± 0.02 | 2.629 ± 0.025 |
Most of the basic statistics you can see at this page can be downloaded from this CSV file
See this proteome in:

Proteome-pI is available under Creative Commons Attribution-NoDerivs license, for more details see here
| Reference: Kozlowski LP. Proteome-pI 2.0: Proteome Isoelectric Point Database Update. Nucleic Acids Res. 2021, doi: 10.1093/nar/gkab944 | Contact: Lukasz P. Kozlowski |