Budgerigar fledgling disease virus - 1
Taxonomy: Viruses; Monodnaviria; Shotokuvirae; Cossaviricota; Papovaviricetes; Sepolyvirales; Polyomaviridae; Gammapolyomavirus; Aves polyomavirus 1
Average proteome isoelectric point is 6.52
Get precalculated fractions of proteins
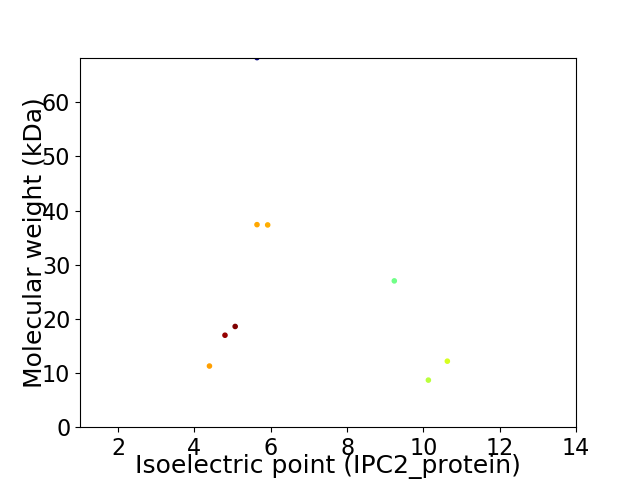
Virtual 2D-PAGE plot for 9 proteins (isoelectric point calculated using IPC2_protein)
Get csv file with sequences according to given criteria:
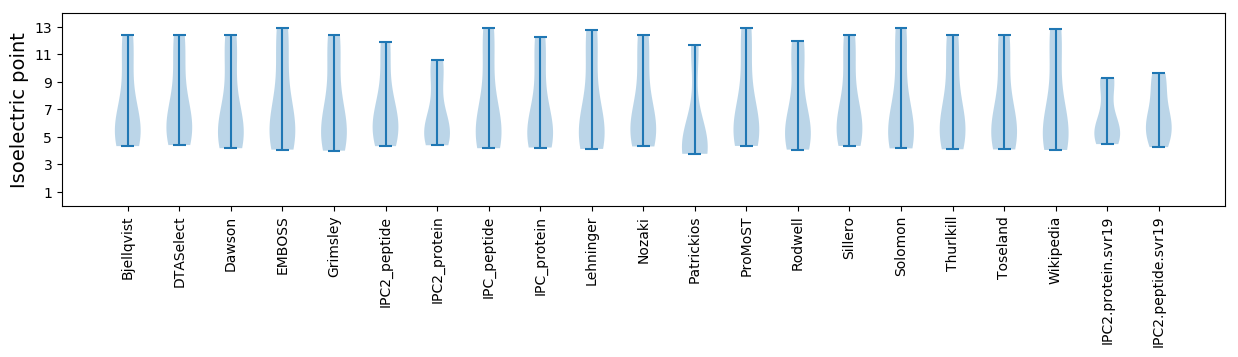
* You can choose from 21 different methods for calculating isoelectric point
Summary statistics related to proteome-wise predictions
Protein with the lowest isoelectric point:
>tr|Q9IBL3|Q9IBL3_BFPYV Large T antigen OS=Budgerigar fledgling disease virus - 1 OX=133789 PE=4 SV=1
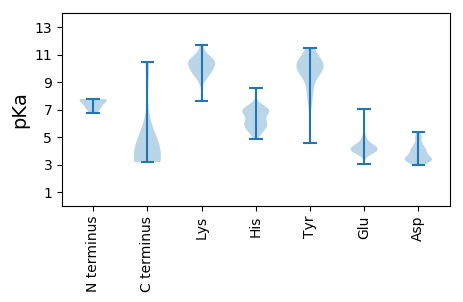
MM1 pKa = 7.13STPARR6 pKa = 11.84DD7 pKa = 3.44PNTAGTAALSPFSTPNHH24 pKa = 5.79EE25 pKa = 4.42LRR27 pKa = 11.84APGPGEE33 pKa = 3.59AHH35 pKa = 6.97SPFTPTAAPGSQPAGSLSDD54 pKa = 4.5PEE56 pKa = 5.47DD57 pKa = 4.64GPDD60 pKa = 3.35PTFNFYY66 pKa = 10.23IQPNSPTPTATTPEE80 pKa = 4.24ASPAAPTTEE89 pKa = 4.29STEE92 pKa = 4.19TTGPSVATNATEE104 pKa = 4.09PSEE107 pKa = 4.25SRR109 pKa = 11.84PARR112 pKa = 3.7
MM1 pKa = 7.13STPARR6 pKa = 11.84DD7 pKa = 3.44PNTAGTAALSPFSTPNHH24 pKa = 5.79EE25 pKa = 4.42LRR27 pKa = 11.84APGPGEE33 pKa = 3.59AHH35 pKa = 6.97SPFTPTAAPGSQPAGSLSDD54 pKa = 4.5PEE56 pKa = 5.47DD57 pKa = 4.64GPDD60 pKa = 3.35PTFNFYY66 pKa = 10.23IQPNSPTPTATTPEE80 pKa = 4.24ASPAAPTTEE89 pKa = 4.29STEE92 pKa = 4.19TTGPSVATNATEE104 pKa = 4.09PSEE107 pKa = 4.25SRR109 pKa = 11.84PARR112 pKa = 3.7
Molecular weight: 11.3 kDa
Isoelectric point according different methods:
Protein with the highest isoelectric point:
>tr|E4MVD7|E4MVD7_BFPYV Agnoprotein 2b OS=Budgerigar fledgling disease virus - 1 OX=133789 PE=4 SV=1
MM1 pKa = 7.76PNGTPTLNRR10 pKa = 11.84PLARR14 pKa = 11.84LALRR18 pKa = 11.84ITSCAHH24 pKa = 5.48QGLEE28 pKa = 3.75RR29 pKa = 11.84LIRR32 pKa = 11.84LLHH35 pKa = 6.34LLLHH39 pKa = 6.85LGRR42 pKa = 11.84SLLDD46 pKa = 3.37LFQTLRR52 pKa = 11.84TALTQPSTSIFSLTRR67 pKa = 11.84LPLLLPPLRR76 pKa = 11.84LLLLLLLPSPPRR88 pKa = 11.84QPALASRR95 pKa = 11.84LTQPNRR101 pKa = 11.84PNRR104 pKa = 11.84GRR106 pKa = 11.84LAKK109 pKa = 10.46
MM1 pKa = 7.76PNGTPTLNRR10 pKa = 11.84PLARR14 pKa = 11.84LALRR18 pKa = 11.84ITSCAHH24 pKa = 5.48QGLEE28 pKa = 3.75RR29 pKa = 11.84LIRR32 pKa = 11.84LLHH35 pKa = 6.34LLLHH39 pKa = 6.85LGRR42 pKa = 11.84SLLDD46 pKa = 3.37LFQTLRR52 pKa = 11.84TALTQPSTSIFSLTRR67 pKa = 11.84LPLLLPPLRR76 pKa = 11.84LLLLLLLPSPPRR88 pKa = 11.84QPALASRR95 pKa = 11.84LTQPNRR101 pKa = 11.84PNRR104 pKa = 11.84GRR106 pKa = 11.84LAKK109 pKa = 10.46
Molecular weight: 12.2 kDa
Isoelectric point according different methods:
Peptides (in silico digests for buttom-up proteomics)
Below you can find in silico digests of the whole proteome with Trypsin, Chymotrypsin, Trypsin+LysC, LysN, ArgC proteases suitable for different mass spec machines.| Try ESI |
 |
|---|
| ChTry ESI |
|
|---|
| ArgC ESI |
|
|---|
| LysN ESI |
|
|---|
| TryLysC ESI |
|
|---|
| Try MALDI |
|
|---|
| ChTry MALDI |
|
|---|
| ArgC MALDI |
|
|---|
| LysN MALDI |
|
|---|
| TryLysC MALDI |
|
|---|
| Try LTQ |
|
|---|
| ChTry LTQ |
|
|---|
| ArgC LTQ |
|
|---|
| LysN LTQ |
|
|---|
| TryLysC LTQ |
|
|---|
| Try MSlow |
|
|---|
| ChTry MSlow |
|
|---|
| ArgC MSlow |
|
|---|
| LysN MSlow |
|
|---|
| TryLysC MSlow |
|
|---|
| Try MShigh |
|
|---|
| ChTry MShigh |
|
|---|
| ArgC MShigh |
|
|---|
| LysN MShigh |
|
|---|
| TryLysC MShigh |
|
|---|
General Statistics
Number of major isoforms |
Number of additional isoforms |
Number of all proteins |
Number of amino acids |
Min. Seq. Length |
Max. Seq. Length |
Avg. Seq. Length |
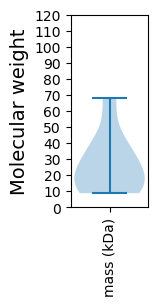
Avg. Mol. Weight |
|---|---|---|---|---|---|---|---|
0 |
2139 |
79 |
599 |
237.7 |
26.43 |
Amino acid frequency
Ala |
Cys |
Asp |
Glu |
Phe |
Gly |
His |
Ile |
Lys |
Leu |
|---|---|---|---|---|---|---|---|---|---|
8.322 ± 1.055 | 1.356 ± 0.507 |
4.956 ± 0.673 | 6.732 ± 0.784 |
3.273 ± 0.466 | 6.358 ± 1.045 |
2.057 ± 0.419 | 4.535 ± 0.68 |
4.208 ± 0.85 | 10.519 ± 1.59 |
Met |
Asn |
Gln |
Pro |
Arg |
Ser |
Thr |
Val |
Trp |
Tyr |
|---|---|---|---|---|---|---|---|---|---|
2.104 ± 0.286 | 3.693 ± 0.269 |
7.62 ± 1.266 | 4.628 ± 0.517 |
6.826 ± 0.695 | 5.704 ± 0.832 |
8.275 ± 0.867 | 5.002 ± 0.745 |
0.888 ± 0.329 | 2.945 ± 0.398 |
Most of the basic statistics you can see at this page can be downloaded from this CSV file
See this proteome in:

Proteome-pI is available under Creative Commons Attribution-NoDerivs license, for more details see here
| Reference: Kozlowski LP. Proteome-pI 2.0: Proteome Isoelectric Point Database Update. Nucleic Acids Res. 2021, doi: 10.1093/nar/gkab944 | Contact: Lukasz P. Kozlowski |