Staphylococcus phage PVL
Taxonomy: Viruses; Duplodnaviria; Heunggongvirae; Uroviricota; Caudoviricetes; Caudovirales; Siphoviridae; Bronfenbrennervirinae; Peeveelvirus; Staphylococcus virus PVL
Average proteome isoelectric point is 6.77
Get precalculated fractions of proteins
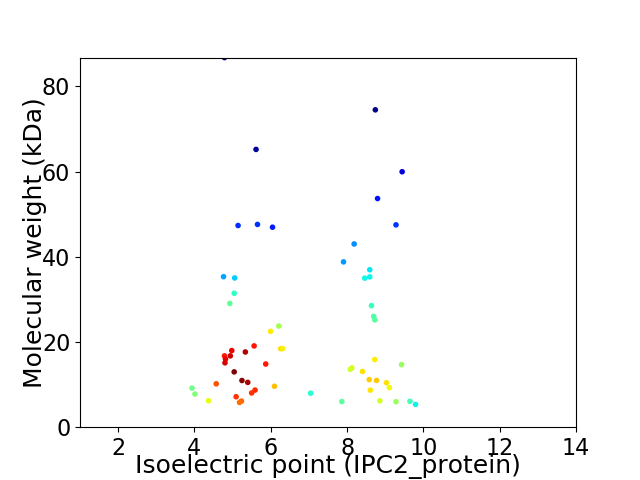
Virtual 2D-PAGE plot for 62 proteins (isoelectric point calculated using IPC2_protein)
Get csv file with sequences according to given criteria:
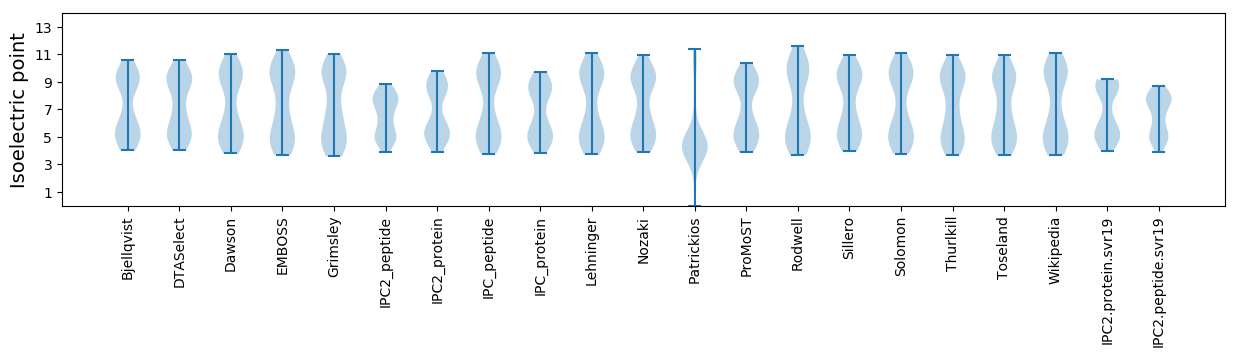
* You can choose from 21 different methods for calculating isoelectric point
Summary statistics related to proteome-wise predictions
Protein with the lowest isoelectric point:
>tr|O80096|O80096_9CAUD Uncharacterized protein OS=Staphylococcus phage PVL OX=71366 PE=4 SV=1
MM1 pKa = 7.28GCLVVVKK8 pKa = 10.07EE9 pKa = 3.89ILRR12 pKa = 11.84LLFLLAMYY20 pKa = 10.04EE21 pKa = 3.83LGKK24 pKa = 10.83YY25 pKa = 7.27VTEE28 pKa = 3.84QVYY31 pKa = 10.94IMMTANDD38 pKa = 4.14DD39 pKa = 3.7VEE41 pKa = 5.3APSDD45 pKa = 3.63YY46 pKa = 11.0VFRR49 pKa = 11.84AEE51 pKa = 4.19VSEE54 pKa = 4.17
MM1 pKa = 7.28GCLVVVKK8 pKa = 10.07EE9 pKa = 3.89ILRR12 pKa = 11.84LLFLLAMYY20 pKa = 10.04EE21 pKa = 3.83LGKK24 pKa = 10.83YY25 pKa = 7.27VTEE28 pKa = 3.84QVYY31 pKa = 10.94IMMTANDD38 pKa = 4.14DD39 pKa = 3.7VEE41 pKa = 5.3APSDD45 pKa = 3.63YY46 pKa = 11.0VFRR49 pKa = 11.84AEE51 pKa = 4.19VSEE54 pKa = 4.17
Molecular weight: 6.21 kDa
Isoelectric point according different methods:
Protein with the highest isoelectric point:
>tr|O80066|O80066_9CAUD LukS-PV OS=Staphylococcus phage PVL OX=71366 PE=1 SV=1
MM1 pKa = 7.54IKK3 pKa = 10.33KK4 pKa = 9.52LLWSTISWFYY14 pKa = 11.55VYY16 pKa = 10.47YY17 pKa = 9.12QSKK20 pKa = 9.42YY21 pKa = 10.26KK22 pKa = 10.83LFIICLVMNGFFRR35 pKa = 11.84NNSKK39 pKa = 8.53KK40 pKa = 8.2THH42 pKa = 5.55LL43 pKa = 4.1
MM1 pKa = 7.54IKK3 pKa = 10.33KK4 pKa = 9.52LLWSTISWFYY14 pKa = 11.55VYY16 pKa = 10.47YY17 pKa = 9.12QSKK20 pKa = 9.42YY21 pKa = 10.26KK22 pKa = 10.83LFIICLVMNGFFRR35 pKa = 11.84NNSKK39 pKa = 8.53KK40 pKa = 8.2THH42 pKa = 5.55LL43 pKa = 4.1
Molecular weight: 5.35 kDa
Isoelectric point according different methods:
Peptides (in silico digests for buttom-up proteomics)
Below you can find in silico digests of the whole proteome with Trypsin, Chymotrypsin, Trypsin+LysC, LysN, ArgC proteases suitable for different mass spec machines.| Try ESI |
 |
|---|
| ChTry ESI |
|
|---|
| ArgC ESI |
|
|---|
| LysN ESI |
|
|---|
| TryLysC ESI |
|
|---|
| Try MALDI |
|
|---|
| ChTry MALDI |
|
|---|
| ArgC MALDI |
|
|---|
| LysN MALDI |
|
|---|
| TryLysC MALDI |
|
|---|
| Try LTQ |
|
|---|
| ChTry LTQ |
|
|---|
| ArgC LTQ |
|
|---|
| LysN LTQ |
|
|---|
| TryLysC LTQ |
|
|---|
| Try MSlow |
|
|---|
| ChTry MSlow |
|
|---|
| ArgC MSlow |
|
|---|
| LysN MSlow |
|
|---|
| TryLysC MSlow |
|
|---|
| Try MShigh |
|
|---|
| ChTry MShigh |
|
|---|
| ArgC MShigh |
|
|---|
| LysN MShigh |
|
|---|
| TryLysC MShigh |
|
|---|
General Statistics
Number of major isoforms |
Number of additional isoforms |
Number of all proteins |
Number of amino acids |
Min. Seq. Length |
Max. Seq. Length |
Avg. Seq. Length |
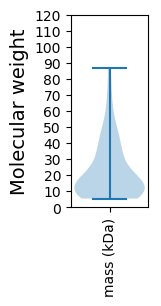
Avg. Mol. Weight |
|---|---|---|---|---|---|---|---|
0 |
12383 |
43 |
759 |
199.7 |
22.89 |
Amino acid frequency
Ala |
Cys |
Asp |
Glu |
Phe |
Gly |
His |
Ile |
Lys |
Leu |
|---|---|---|---|---|---|---|---|---|---|
5.176 ± 0.477 | 0.557 ± 0.102 |
6.178 ± 0.276 | 7.26 ± 0.476 |
3.973 ± 0.235 | 5.701 ± 0.466 |
1.712 ± 0.181 | 7.89 ± 0.284 |
9.117 ± 0.332 | 8.092 ± 0.331 |
Met |
Asn |
Gln |
Pro |
Arg |
Ser |
Thr |
Val |
Trp |
Tyr |
|---|---|---|---|---|---|---|---|---|---|
2.6 ± 0.188 | 7.155 ± 0.28 |
2.512 ± 0.178 | 4.03 ± 0.248 |
4.329 ± 0.234 | 6.202 ± 0.273 |
6.162 ± 0.239 | 5.903 ± 0.23 |
1.09 ± 0.143 | 4.361 ± 0.261 |
Most of the basic statistics you can see at this page can be downloaded from this CSV file
See this proteome in:

Proteome-pI is available under Creative Commons Attribution-NoDerivs license, for more details see here
| Reference: Kozlowski LP. Proteome-pI 2.0: Proteome Isoelectric Point Database Update. Nucleic Acids Res. 2021, doi: 10.1093/nar/gkab944 | Contact: Lukasz P. Kozlowski |