Mycobacterium phage ACFishhook
Taxonomy: Viruses; Duplodnaviria; Heunggongvirae; Uroviricota; Caudoviricetes; Caudovirales; Siphoviridae; Fromanvirus; unclassified Fromanvirus
Average proteome isoelectric point is 6.21
Get precalculated fractions of proteins
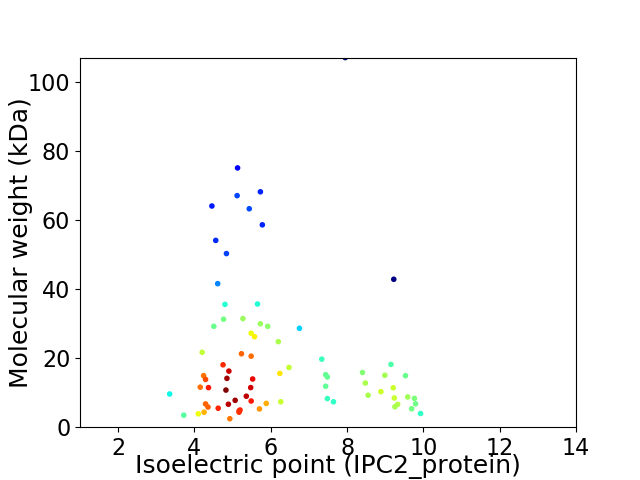
Virtual 2D-PAGE plot for 77 proteins (isoelectric point calculated using IPC2_protein)
Get csv file with sequences according to given criteria:
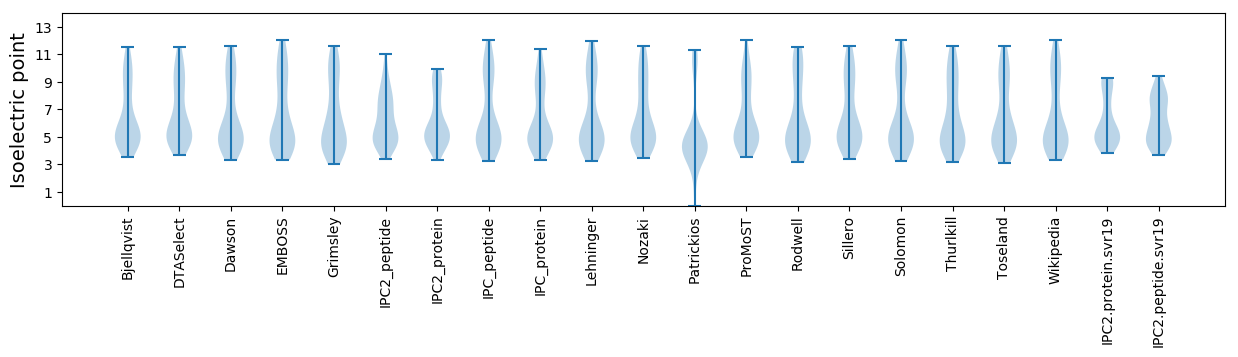
* You can choose from 21 different methods for calculating isoelectric point
Summary statistics related to proteome-wise predictions
Protein with the lowest isoelectric point:
>tr|A0A3Q9R8H5|A0A3Q9R8H5_9CAUD Uncharacterized protein OS=Mycobacterium phage ACFishhook OX=2500573 GN=6 PE=4 SV=1
MM1 pKa = 7.74NDD3 pKa = 3.6PEE5 pKa = 4.12QLALFDD11 pKa = 3.88VDD13 pKa = 3.63EE14 pKa = 5.19LGWTEE19 pKa = 4.08SVHH22 pKa = 7.58DD23 pKa = 4.28YY24 pKa = 10.62VHH26 pKa = 6.77QGDD29 pKa = 3.98EE30 pKa = 3.96
MM1 pKa = 7.74NDD3 pKa = 3.6PEE5 pKa = 4.12QLALFDD11 pKa = 3.88VDD13 pKa = 3.63EE14 pKa = 5.19LGWTEE19 pKa = 4.08SVHH22 pKa = 7.58DD23 pKa = 4.28YY24 pKa = 10.62VHH26 pKa = 6.77QGDD29 pKa = 3.98EE30 pKa = 3.96
Molecular weight: 3.49 kDa
Isoelectric point according different methods:
Protein with the highest isoelectric point:
>tr|A0A3Q9R8J2|A0A3Q9R8J2_9CAUD DNA primase OS=Mycobacterium phage ACFishhook OX=2500573 GN=58 PE=4 SV=1
MM1 pKa = 6.62TVKK4 pKa = 10.65VNGRR8 pKa = 11.84KK9 pKa = 9.46LEE11 pKa = 4.51PGTEE15 pKa = 3.96VSIKK19 pKa = 10.24GEE21 pKa = 3.72RR22 pKa = 11.84GRR24 pKa = 11.84YY25 pKa = 8.8RR26 pKa = 11.84FVKK29 pKa = 9.76ATTTSQGKK37 pKa = 7.25TVLDD41 pKa = 4.81FIGGPAGHH49 pKa = 5.74EE50 pKa = 4.16QWRR53 pKa = 11.84SFYY56 pKa = 9.51PEE58 pKa = 3.66RR59 pKa = 11.84VEE61 pKa = 4.27TVHH64 pKa = 7.27RR65 pKa = 11.84IARR68 pKa = 11.84TRR70 pKa = 11.84ANAKK74 pKa = 9.8
MM1 pKa = 6.62TVKK4 pKa = 10.65VNGRR8 pKa = 11.84KK9 pKa = 9.46LEE11 pKa = 4.51PGTEE15 pKa = 3.96VSIKK19 pKa = 10.24GEE21 pKa = 3.72RR22 pKa = 11.84GRR24 pKa = 11.84YY25 pKa = 8.8RR26 pKa = 11.84FVKK29 pKa = 9.76ATTTSQGKK37 pKa = 7.25TVLDD41 pKa = 4.81FIGGPAGHH49 pKa = 5.74EE50 pKa = 4.16QWRR53 pKa = 11.84SFYY56 pKa = 9.51PEE58 pKa = 3.66RR59 pKa = 11.84VEE61 pKa = 4.27TVHH64 pKa = 7.27RR65 pKa = 11.84IARR68 pKa = 11.84TRR70 pKa = 11.84ANAKK74 pKa = 9.8
Molecular weight: 8.36 kDa
Isoelectric point according different methods:
Peptides (in silico digests for buttom-up proteomics)
Below you can find in silico digests of the whole proteome with Trypsin, Chymotrypsin, Trypsin+LysC, LysN, ArgC proteases suitable for different mass spec machines.| Try ESI |
 |
|---|
| ChTry ESI |
|
|---|
| ArgC ESI |
|
|---|
| LysN ESI |
|
|---|
| TryLysC ESI |
|
|---|
| Try MALDI |
|
|---|
| ChTry MALDI |
|
|---|
| ArgC MALDI |
|
|---|
| LysN MALDI |
|
|---|
| TryLysC MALDI |
|
|---|
| Try LTQ |
|
|---|
| ChTry LTQ |
|
|---|
| ArgC LTQ |
|
|---|
| LysN LTQ |
|
|---|
| TryLysC LTQ |
|
|---|
| Try MSlow |
|
|---|
| ChTry MSlow |
|
|---|
| ArgC MSlow |
|
|---|
| LysN MSlow |
|
|---|
| TryLysC MSlow |
|
|---|
| Try MShigh |
|
|---|
| ChTry MShigh |
|
|---|
| ArgC MShigh |
|
|---|
| LysN MShigh |
|
|---|
| TryLysC MShigh |
|
|---|
General Statistics
Number of major isoforms |
Number of additional isoforms |
Number of all proteins |
Number of amino acids |
Min. Seq. Length |
Max. Seq. Length |
Avg. Seq. Length |
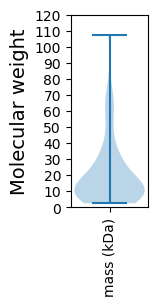
Avg. Mol. Weight |
|---|---|---|---|---|---|---|---|
0 |
14471 |
20 |
1008 |
187.9 |
20.78 |
Amino acid frequency
Ala |
Cys |
Asp |
Glu |
Phe |
Gly |
His |
Ile |
Lys |
Leu |
|---|---|---|---|---|---|---|---|---|---|
9.84 ± 0.384 | 0.663 ± 0.097 |
6.309 ± 0.234 | 6.765 ± 0.334 |
3.393 ± 0.221 | 8.631 ± 0.599 |
1.99 ± 0.187 | 4.685 ± 0.187 |
4.319 ± 0.208 | 8.216 ± 0.338 |
Met |
Asn |
Gln |
Pro |
Arg |
Ser |
Thr |
Val |
Trp |
Tyr |
|---|---|---|---|---|---|---|---|---|---|
2.598 ± 0.216 | 3.269 ± 0.187 |
5.66 ± 0.329 | 3.911 ± 0.326 |
6.731 ± 0.376 | 5.065 ± 0.204 |
6.15 ± 0.239 | 6.966 ± 0.222 |
1.907 ± 0.151 | 2.93 ± 0.195 |
Most of the basic statistics you can see at this page can be downloaded from this CSV file
See this proteome in:

Proteome-pI is available under Creative Commons Attribution-NoDerivs license, for more details see here
| Reference: Kozlowski LP. Proteome-pI 2.0: Proteome Isoelectric Point Database Update. Nucleic Acids Res. 2021, doi: 10.1093/nar/gkab944 | Contact: Lukasz P. Kozlowski |