Mycolicibacterium tokaiense
Taxonomy: cellular organisms; Bacteria; Terrabacteria group; Actinobacteria; Actinomycetia; Corynebacteriales;
Average proteome isoelectric point is 5.97
Get precalculated fractions of proteins
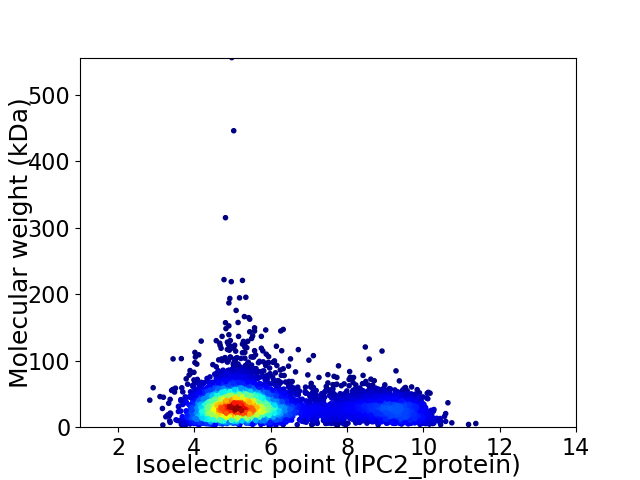
Virtual 2D-PAGE plot for 6211 proteins (isoelectric point calculated using IPC2_protein)
Get csv file with sequences according to given criteria:
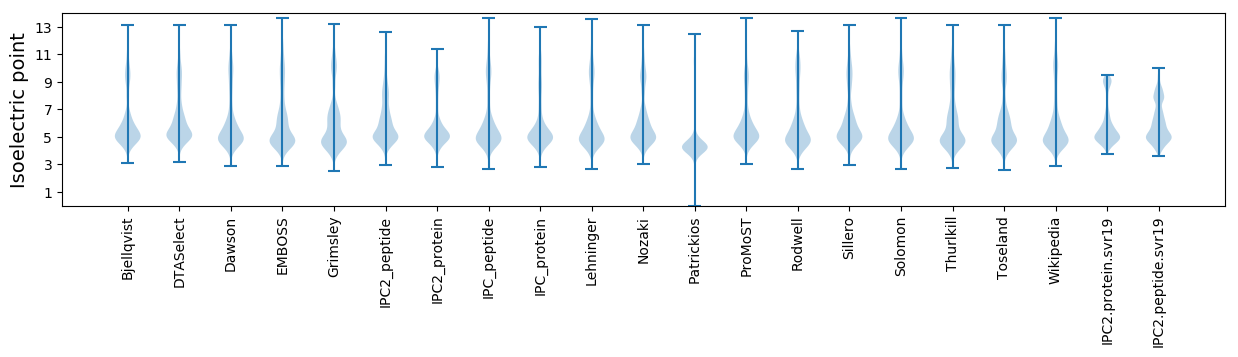
* You can choose from 21 different methods for calculating isoelectric point
Summary statistics related to proteome-wise predictions
Protein with the lowest isoelectric point:
>tr|A0A378TKH4|A0A378TKH4_9MYCO Peptidase S8 and S53 subtilisin kexin sedolisin OS=Mycolicibacterium tokaiense OX=39695 GN=NCTC10821_03852 PE=4 SV=1
MM1 pKa = 7.53ALIKK5 pKa = 10.64SFSVTTALFAAAFSLAAPATADD27 pKa = 3.34DD28 pKa = 4.78QMFADD33 pKa = 4.63ALDD36 pKa = 4.12MIGVSVGDD44 pKa = 3.61PAAVGRR50 pKa = 11.84GVCASFDD57 pKa = 3.52AGQTLPAVVDD67 pKa = 3.79QLSAAHH73 pKa = 7.38GITVDD78 pKa = 3.89DD79 pKa = 4.35ASMVAGFSVAEE90 pKa = 4.16YY91 pKa = 10.11CDD93 pKa = 3.51HH94 pKa = 7.5HH95 pKa = 6.97EE96 pKa = 4.51GALTLGG102 pKa = 3.8
MM1 pKa = 7.53ALIKK5 pKa = 10.64SFSVTTALFAAAFSLAAPATADD27 pKa = 3.34DD28 pKa = 4.78QMFADD33 pKa = 4.63ALDD36 pKa = 4.12MIGVSVGDD44 pKa = 3.61PAAVGRR50 pKa = 11.84GVCASFDD57 pKa = 3.52AGQTLPAVVDD67 pKa = 3.79QLSAAHH73 pKa = 7.38GITVDD78 pKa = 3.89DD79 pKa = 4.35ASMVAGFSVAEE90 pKa = 4.16YY91 pKa = 10.11CDD93 pKa = 3.51HH94 pKa = 7.5HH95 pKa = 6.97EE96 pKa = 4.51GALTLGG102 pKa = 3.8
Molecular weight: 10.19 kDa
Isoelectric point according different methods:
Protein with the highest isoelectric point:
>tr|A0A378THS6|A0A378THS6_9MYCO Fructose-2 6-bisphosphatase OS=Mycolicibacterium tokaiense OX=39695 GN=NCTC10821_02638 PE=4 SV=1
MM1 pKa = 7.69AKK3 pKa = 10.06GKK5 pKa = 8.69RR6 pKa = 11.84TFQPNNRR13 pKa = 11.84RR14 pKa = 11.84RR15 pKa = 11.84ARR17 pKa = 11.84VHH19 pKa = 5.99GFRR22 pKa = 11.84LRR24 pKa = 11.84MRR26 pKa = 11.84TRR28 pKa = 11.84AGRR31 pKa = 11.84AIVTGRR37 pKa = 11.84RR38 pKa = 11.84RR39 pKa = 11.84KK40 pKa = 9.68GRR42 pKa = 11.84RR43 pKa = 11.84SLTAA47 pKa = 3.9
MM1 pKa = 7.69AKK3 pKa = 10.06GKK5 pKa = 8.69RR6 pKa = 11.84TFQPNNRR13 pKa = 11.84RR14 pKa = 11.84RR15 pKa = 11.84ARR17 pKa = 11.84VHH19 pKa = 5.99GFRR22 pKa = 11.84LRR24 pKa = 11.84MRR26 pKa = 11.84TRR28 pKa = 11.84AGRR31 pKa = 11.84AIVTGRR37 pKa = 11.84RR38 pKa = 11.84RR39 pKa = 11.84KK40 pKa = 9.68GRR42 pKa = 11.84RR43 pKa = 11.84SLTAA47 pKa = 3.9
Molecular weight: 5.56 kDa
Isoelectric point according different methods:
Peptides (in silico digests for buttom-up proteomics)
Below you can find in silico digests of the whole proteome with Trypsin, Chymotrypsin, Trypsin+LysC, LysN, ArgC proteases suitable for different mass spec machines.| Try ESI |
 |
|---|
| ChTry ESI |
|
|---|
| ArgC ESI |
|
|---|
| LysN ESI |
|
|---|
| TryLysC ESI |
|
|---|
| Try MALDI |
|
|---|
| ChTry MALDI |
|
|---|
| ArgC MALDI |
|
|---|
| LysN MALDI |
|
|---|
| TryLysC MALDI |
|
|---|
| Try LTQ |
|
|---|
| ChTry LTQ |
|
|---|
| ArgC LTQ |
|
|---|
| LysN LTQ |
|
|---|
| TryLysC LTQ |
|
|---|
| Try MSlow |
|
|---|
| ChTry MSlow |
|
|---|
| ArgC MSlow |
|
|---|
| LysN MSlow |
|
|---|
| TryLysC MSlow |
|
|---|
| Try MShigh |
|
|---|
| ChTry MShigh |
|
|---|
| ArgC MShigh |
|
|---|
| LysN MShigh |
|
|---|
| TryLysC MShigh |
|
|---|
General Statistics
Number of major isoforms |
Number of additional isoforms |
Number of all proteins |
Number of amino acids |
Min. Seq. Length |
Max. Seq. Length |
Avg. Seq. Length |
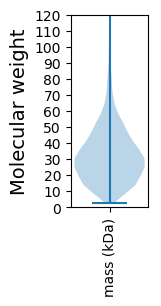
Avg. Mol. Weight |
|---|---|---|---|---|---|---|---|
0 |
1976286 |
29 |
5196 |
318.2 |
34.04 |
Amino acid frequency
Ala |
Cys |
Asp |
Glu |
Phe |
Gly |
His |
Ile |
Lys |
Leu |
|---|---|---|---|---|---|---|---|---|---|
13.312 ± 0.042 | 0.786 ± 0.009 |
6.276 ± 0.028 | 5.095 ± 0.029 |
3.066 ± 0.023 | 8.926 ± 0.034 |
2.184 ± 0.016 | 4.181 ± 0.021 |
1.894 ± 0.021 | 10.047 ± 0.04 |
Met |
Asn |
Gln |
Pro |
Arg |
Ser |
Thr |
Val |
Trp |
Tyr |
|---|---|---|---|---|---|---|---|---|---|
2.026 ± 0.011 | 2.118 ± 0.016 |
5.747 ± 0.03 | 3.066 ± 0.017 |
7.068 ± 0.032 | 5.41 ± 0.022 |
6.286 ± 0.025 | 8.959 ± 0.031 |
1.481 ± 0.014 | 2.072 ± 0.013 |
Most of the basic statistics you can see at this page can be downloaded from this CSV file
See this proteome in:

Proteome-pI is available under Creative Commons Attribution-NoDerivs license, for more details see here
| Reference: Kozlowski LP. Proteome-pI 2.0: Proteome Isoelectric Point Database Update. Nucleic Acids Res. 2021, doi: 10.1093/nar/gkab944 | Contact: Lukasz P. Kozlowski |