Rhizobium etli
Taxonomy: cellular organisms;
Average proteome isoelectric point is 6.44
Get precalculated fractions of proteins
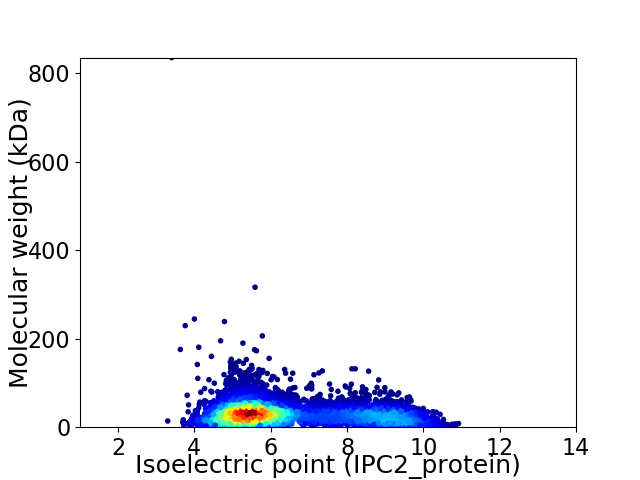
Virtual 2D-PAGE plot for 6373 proteins (isoelectric point calculated using IPC2_protein)
Get csv file with sequences according to given criteria:
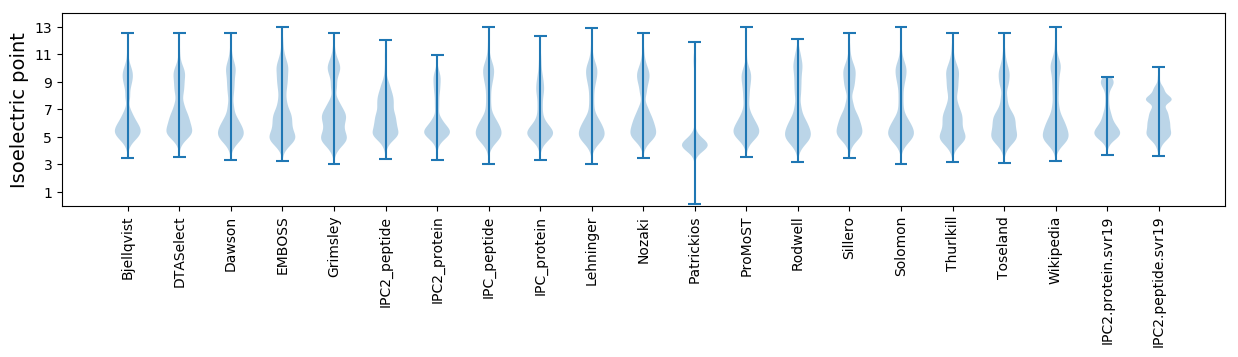
* You can choose from 21 different methods for calculating isoelectric point
Summary statistics related to proteome-wise predictions
Protein with the lowest isoelectric point:
>tr|A0A327XDZ5|A0A327XDZ5_RHIET Diguanylate cyclase (GGDEF)-like protein OS=Rhizobium etli OX=29449 GN=BCL34_11815 PE=4 SV=1
MM1 pKa = 7.3KK2 pKa = 9.79MNYY5 pKa = 8.86GAAAFVAATVGFCPLHH21 pKa = 5.78AAWAEE26 pKa = 4.17VAVNGALFLGATDD39 pKa = 4.58DD40 pKa = 4.86GYY42 pKa = 11.84GNTDD46 pKa = 3.51SEE48 pKa = 4.25IHH50 pKa = 6.85LDD52 pKa = 3.77LNSSGKK58 pKa = 9.81FALSDD63 pKa = 3.47AVTLGFDD70 pKa = 4.15VEE72 pKa = 4.37FDD74 pKa = 3.24VDD76 pKa = 4.45NIDD79 pKa = 5.46DD80 pKa = 3.87VPTQYY85 pKa = 10.55RR86 pKa = 11.84GSLDD90 pKa = 3.69DD91 pKa = 3.53FTVYY95 pKa = 9.94MISGAMVSS103 pKa = 3.44
MM1 pKa = 7.3KK2 pKa = 9.79MNYY5 pKa = 8.86GAAAFVAATVGFCPLHH21 pKa = 5.78AAWAEE26 pKa = 4.17VAVNGALFLGATDD39 pKa = 4.58DD40 pKa = 4.86GYY42 pKa = 11.84GNTDD46 pKa = 3.51SEE48 pKa = 4.25IHH50 pKa = 6.85LDD52 pKa = 3.77LNSSGKK58 pKa = 9.81FALSDD63 pKa = 3.47AVTLGFDD70 pKa = 4.15VEE72 pKa = 4.37FDD74 pKa = 3.24VDD76 pKa = 4.45NIDD79 pKa = 5.46DD80 pKa = 3.87VPTQYY85 pKa = 10.55RR86 pKa = 11.84GSLDD90 pKa = 3.69DD91 pKa = 3.53FTVYY95 pKa = 9.94MISGAMVSS103 pKa = 3.44
Molecular weight: 10.88 kDa
Isoelectric point according different methods:
Protein with the highest isoelectric point:
>tr|A0A327Y532|A0A327Y532_RHIET Cystathionine beta-lyase OS=Rhizobium etli OX=29449 GN=BCL34_104127 PE=3 SV=1
NN1 pKa = 6.55RR2 pKa = 11.84HH3 pKa = 5.78HH4 pKa = 7.08RR5 pKa = 11.84VLPPRR10 pKa = 11.84LARR13 pKa = 11.84LNRR16 pKa = 11.84MISKK20 pKa = 9.98RR21 pKa = 11.84RR22 pKa = 11.84AAVEE26 pKa = 4.17TTFATLKK33 pKa = 10.54HH34 pKa = 6.08RR35 pKa = 11.84MGLGLIRR42 pKa = 11.84YY43 pKa = 8.2RR44 pKa = 11.84GLVKK48 pKa = 10.6ARR50 pKa = 11.84AQVLMATIAFNMRR63 pKa = 11.84RR64 pKa = 11.84WVTMATT70 pKa = 3.53
NN1 pKa = 6.55RR2 pKa = 11.84HH3 pKa = 5.78HH4 pKa = 7.08RR5 pKa = 11.84VLPPRR10 pKa = 11.84LARR13 pKa = 11.84LNRR16 pKa = 11.84MISKK20 pKa = 9.98RR21 pKa = 11.84RR22 pKa = 11.84AAVEE26 pKa = 4.17TTFATLKK33 pKa = 10.54HH34 pKa = 6.08RR35 pKa = 11.84MGLGLIRR42 pKa = 11.84YY43 pKa = 8.2RR44 pKa = 11.84GLVKK48 pKa = 10.6ARR50 pKa = 11.84AQVLMATIAFNMRR63 pKa = 11.84RR64 pKa = 11.84WVTMATT70 pKa = 3.53
Molecular weight: 8.18 kDa
Isoelectric point according different methods:
Peptides (in silico digests for buttom-up proteomics)
Below you can find in silico digests of the whole proteome with Trypsin, Chymotrypsin, Trypsin+LysC, LysN, ArgC proteases suitable for different mass spec machines.| Try ESI |
 |
|---|
| ChTry ESI |
|
|---|
| ArgC ESI |
|
|---|
| LysN ESI |
|
|---|
| TryLysC ESI |
|
|---|
| Try MALDI |
|
|---|
| ChTry MALDI |
|
|---|
| ArgC MALDI |
|
|---|
| LysN MALDI |
|
|---|
| TryLysC MALDI |
|
|---|
| Try LTQ |
|
|---|
| ChTry LTQ |
|
|---|
| ArgC LTQ |
|
|---|
| LysN LTQ |
|
|---|
| TryLysC LTQ |
|
|---|
| Try MSlow |
|
|---|
| ChTry MSlow |
|
|---|
| ArgC MSlow |
|
|---|
| LysN MSlow |
|
|---|
| TryLysC MSlow |
|
|---|
| Try MShigh |
|
|---|
| ChTry MShigh |
|
|---|
| ArgC MShigh |
|
|---|
| LysN MShigh |
|
|---|
| TryLysC MShigh |
|
|---|
General Statistics
Number of major isoforms |
Number of additional isoforms |
Number of all proteins |
Number of amino acids |
Min. Seq. Length |
Max. Seq. Length |
Avg. Seq. Length |
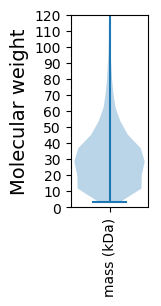
Avg. Mol. Weight |
|---|---|---|---|---|---|---|---|
0 |
1901876 |
29 |
8395 |
298.4 |
32.46 |
Amino acid frequency
Ala |
Cys |
Asp |
Glu |
Phe |
Gly |
His |
Ile |
Lys |
Leu |
|---|---|---|---|---|---|---|---|---|---|
11.806 ± 0.039 | 0.779 ± 0.01 |
5.819 ± 0.029 | 5.648 ± 0.033 |
3.88 ± 0.021 | 8.22 ± 0.037 |
2.006 ± 0.017 | 5.777 ± 0.024 |
3.835 ± 0.03 | 9.78 ± 0.044 |
Met |
Asn |
Gln |
Pro |
Arg |
Ser |
Thr |
Val |
Trp |
Tyr |
|---|---|---|---|---|---|---|---|---|---|
2.622 ± 0.018 | 2.929 ± 0.024 |
4.777 ± 0.024 | 3.141 ± 0.019 |
6.471 ± 0.043 | 6.011 ± 0.026 |
5.494 ± 0.051 | 7.407 ± 0.029 |
1.277 ± 0.014 | 2.319 ± 0.014 |
Most of the basic statistics you can see at this page can be downloaded from this CSV file
See this proteome in:

Proteome-pI is available under Creative Commons Attribution-NoDerivs license, for more details see here
| Reference: Kozlowski LP. Proteome-pI 2.0: Proteome Isoelectric Point Database Update. Nucleic Acids Res. 2021, doi: 10.1093/nar/gkab944 | Contact: Lukasz P. Kozlowski |