Spiroplasma diminutum CUAS-1
Taxonomy: cellular organisms; Bacteria; Terrabacteria group; Tenericutes; Mollicutes; Entomoplasmatales; Spiroplasmataceae; Spiroplasma; Spiroplasma diminutum
Average proteome isoelectric point is 6.75
Get precalculated fractions of proteins
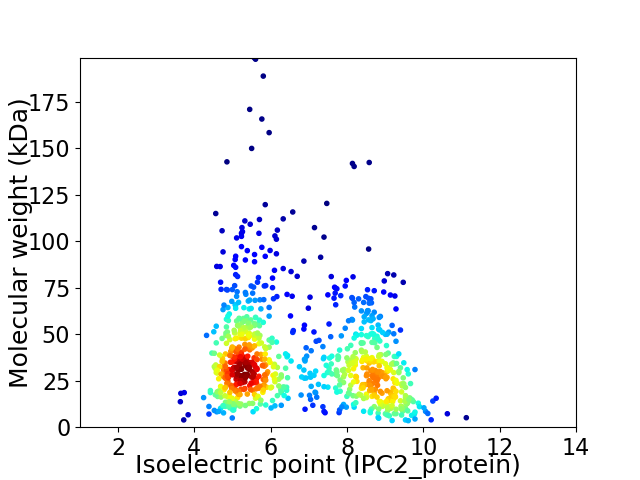
Virtual 2D-PAGE plot for 858 proteins (isoelectric point calculated using IPC2_protein)
Get csv file with sequences according to given criteria:
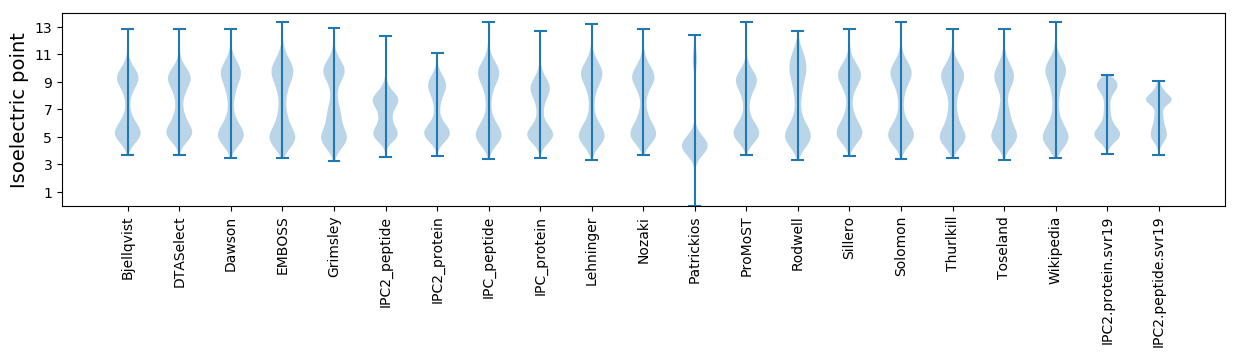
* You can choose from 21 different methods for calculating isoelectric point
Summary statistics related to proteome-wise predictions
Protein with the lowest isoelectric point:
>tr|S5MJ56|S5MJ56_9MOLU Uncharacterized protein OS=Spiroplasma diminutum CUAS-1 OX=1276221 GN=SDIMI_v3c02860 PE=4 SV=1
MM1 pKa = 7.53KK2 pKa = 9.16KK3 pKa = 7.96TWIDD7 pKa = 3.0KK8 pKa = 9.64PMCIGCMACVQIDD21 pKa = 3.66EE22 pKa = 4.7TEE24 pKa = 4.19TLFMDD29 pKa = 4.97DD30 pKa = 5.67DD31 pKa = 4.52GFAEE35 pKa = 4.26ANEE38 pKa = 4.04NDD40 pKa = 4.11LEE42 pKa = 4.25LVEE45 pKa = 4.66CQMVCPTGAVKK56 pKa = 10.39IGDD59 pKa = 3.79EE60 pKa = 4.12
MM1 pKa = 7.53KK2 pKa = 9.16KK3 pKa = 7.96TWIDD7 pKa = 3.0KK8 pKa = 9.64PMCIGCMACVQIDD21 pKa = 3.66EE22 pKa = 4.7TEE24 pKa = 4.19TLFMDD29 pKa = 4.97DD30 pKa = 5.67DD31 pKa = 4.52GFAEE35 pKa = 4.26ANEE38 pKa = 4.04NDD40 pKa = 4.11LEE42 pKa = 4.25LVEE45 pKa = 4.66CQMVCPTGAVKK56 pKa = 10.39IGDD59 pKa = 3.79EE60 pKa = 4.12
Molecular weight: 6.68 kDa
Isoelectric point according different methods:
Protein with the highest isoelectric point:
>tr|S5MDM7|S5MDM7_9MOLU Aspartyl/glutamyl-tRNA(Asn/Gln) amidotransferase subunit B OS=Spiroplasma diminutum CUAS-1 OX=1276221 GN=gatB PE=3 SV=1
MM1 pKa = 7.32KK2 pKa = 9.47RR3 pKa = 11.84TWQPSKK9 pKa = 10.03IKK11 pKa = 10.14HH12 pKa = 5.53ARR14 pKa = 11.84THH16 pKa = 5.78GFRR19 pKa = 11.84ARR21 pKa = 11.84MATKK25 pKa = 10.41NGRR28 pKa = 11.84KK29 pKa = 9.2VIKK32 pKa = 10.14ARR34 pKa = 11.84RR35 pKa = 11.84AKK37 pKa = 10.33GRR39 pKa = 11.84AKK41 pKa = 9.64LTAA44 pKa = 4.21
MM1 pKa = 7.32KK2 pKa = 9.47RR3 pKa = 11.84TWQPSKK9 pKa = 10.03IKK11 pKa = 10.14HH12 pKa = 5.53ARR14 pKa = 11.84THH16 pKa = 5.78GFRR19 pKa = 11.84ARR21 pKa = 11.84MATKK25 pKa = 10.41NGRR28 pKa = 11.84KK29 pKa = 9.2VIKK32 pKa = 10.14ARR34 pKa = 11.84RR35 pKa = 11.84AKK37 pKa = 10.33GRR39 pKa = 11.84AKK41 pKa = 9.64LTAA44 pKa = 4.21
Molecular weight: 5.1 kDa
Isoelectric point according different methods:
Peptides (in silico digests for buttom-up proteomics)
Below you can find in silico digests of the whole proteome with Trypsin, Chymotrypsin, Trypsin+LysC, LysN, ArgC proteases suitable for different mass spec machines.| Try ESI |
 |
|---|
| ChTry ESI |
|
|---|
| ArgC ESI |
|
|---|
| LysN ESI |
|
|---|
| TryLysC ESI |
|
|---|
| Try MALDI |
|
|---|
| ChTry MALDI |
|
|---|
| ArgC MALDI |
|
|---|
| LysN MALDI |
|
|---|
| TryLysC MALDI |
|
|---|
| Try LTQ |
|
|---|
| ChTry LTQ |
|
|---|
| ArgC LTQ |
|
|---|
| LysN LTQ |
|
|---|
| TryLysC LTQ |
|
|---|
| Try MSlow |
|
|---|
| ChTry MSlow |
|
|---|
| ArgC MSlow |
|
|---|
| LysN MSlow |
|
|---|
| TryLysC MSlow |
|
|---|
| Try MShigh |
|
|---|
| ChTry MShigh |
|
|---|
| ArgC MShigh |
|
|---|
| LysN MShigh |
|
|---|
| TryLysC MShigh |
|
|---|
General Statistics
Number of major isoforms |
Number of additional isoforms |
Number of all proteins |
Number of amino acids |
Min. Seq. Length |
Max. Seq. Length |
Avg. Seq. Length |
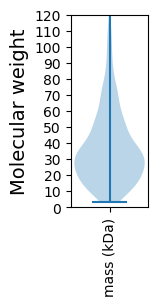
Avg. Mol. Weight |
|---|---|---|---|---|---|---|---|
0 |
291642 |
31 |
1727 |
339.9 |
38.94 |
Amino acid frequency
Ala |
Cys |
Asp |
Glu |
Phe |
Gly |
His |
Ile |
Lys |
Leu |
|---|---|---|---|---|---|---|---|---|---|
4.799 ± 0.094 | 0.667 ± 0.025 |
5.401 ± 0.057 | 7.53 ± 0.081 |
5.447 ± 0.075 | 5.099 ± 0.082 |
1.161 ± 0.029 | 10.348 ± 0.084 |
9.852 ± 0.086 | 9.274 ± 0.073 |
Met |
Asn |
Gln |
Pro |
Arg |
Ser |
Thr |
Val |
Trp |
Tyr |
|---|---|---|---|---|---|---|---|---|---|
2.221 ± 0.034 | 7.679 ± 0.107 |
2.448 ± 0.038 | 3.061 ± 0.045 |
2.906 ± 0.055 | 6.551 ± 0.065 |
5.061 ± 0.05 | 5.566 ± 0.067 |
0.974 ± 0.028 | 3.955 ± 0.055 |
Most of the basic statistics you can see at this page can be downloaded from this CSV file
See this proteome in:

Proteome-pI is available under Creative Commons Attribution-NoDerivs license, for more details see here
| Reference: Kozlowski LP. Proteome-pI 2.0: Proteome Isoelectric Point Database Update. Nucleic Acids Res. 2021, doi: 10.1093/nar/gkab944 | Contact: Lukasz P. Kozlowski |