Glaciihabitans tibetensis
Taxonomy: cellular organisms; Bacteria; Terrabacteria group; Actinobacteria; Actinomycetia; Micrococcales; Microbacteriaceae; Glaciihabitans
Average proteome isoelectric point is 5.99
Get precalculated fractions of proteins
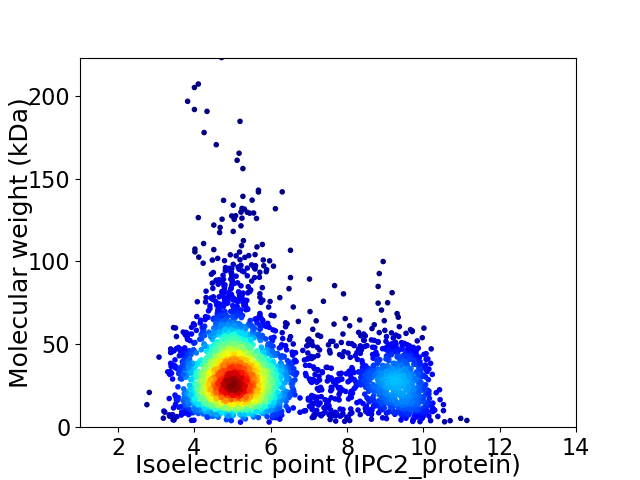
Virtual 2D-PAGE plot for 3456 proteins (isoelectric point calculated using IPC2_protein)
Get csv file with sequences according to given criteria:
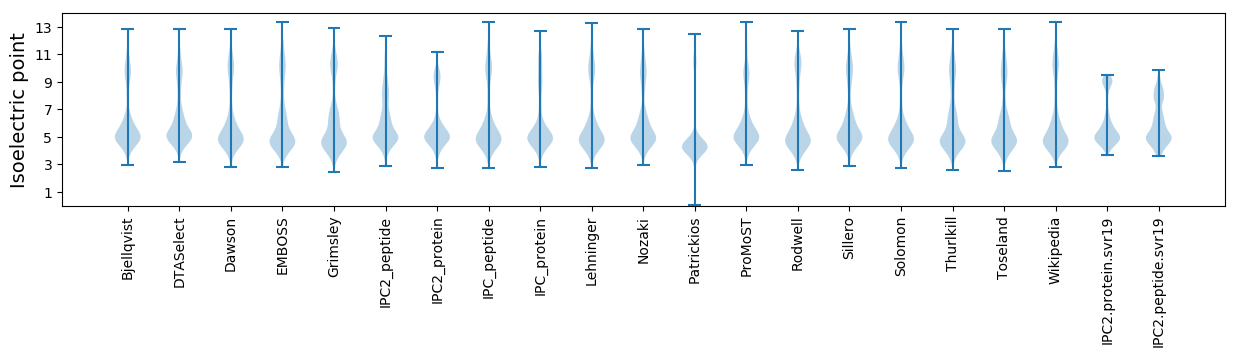
* You can choose from 21 different methods for calculating isoelectric point
Summary statistics related to proteome-wise predictions
Protein with the lowest isoelectric point:
>tr|A0A2T0VCQ4|A0A2T0VCQ4_9MICO Transmembrane protein DUF3566 OS=Glaciihabitans tibetensis OX=1266600 GN=B0I08_105124 PE=4 SV=1
MM1 pKa = 7.38KK2 pKa = 10.26LDD4 pKa = 3.61RR5 pKa = 11.84RR6 pKa = 11.84LVACSALVAAAALLGGCASTPATSTATNPSEE37 pKa = 4.48ADD39 pKa = 3.2AGQSDD44 pKa = 3.83AGEE47 pKa = 4.32TRR49 pKa = 11.84TLPTDD54 pKa = 3.33VQADD58 pKa = 3.84YY59 pKa = 11.3QLGGSYY65 pKa = 9.93EE66 pKa = 4.04PPAGVGLVVRR76 pKa = 11.84DD77 pKa = 3.69SGDD80 pKa = 3.42YY81 pKa = 9.68PAEE84 pKa = 3.93GMYY87 pKa = 10.1SICYY91 pKa = 9.74VNGFQTQPQDD101 pKa = 3.22AAVWLAEE108 pKa = 3.98HH109 pKa = 7.33PEE111 pKa = 4.46LILWEE116 pKa = 4.61GGGRR120 pKa = 11.84AEE122 pKa = 4.51GVDD125 pKa = 3.7GAGQPVIDD133 pKa = 4.87PNWPDD138 pKa = 3.7EE139 pKa = 4.44MILDD143 pKa = 4.37TSTEE147 pKa = 4.25SNRR150 pKa = 11.84TAIAEE155 pKa = 4.44VIGEE159 pKa = 4.48TIAQCGEE166 pKa = 3.91RR167 pKa = 11.84GFDD170 pKa = 3.69AVEE173 pKa = 3.82FDD175 pKa = 5.87NLDD178 pKa = 3.29SWSRR182 pKa = 11.84SSGALTLDD190 pKa = 4.03DD191 pKa = 5.23SIALATLLVDD201 pKa = 4.15KK202 pKa = 11.07AADD205 pKa = 3.47AGLAAGQKK213 pKa = 10.2NSAEE217 pKa = 4.01LATRR221 pKa = 11.84GRR223 pKa = 11.84DD224 pKa = 3.15EE225 pKa = 5.27AGFLFAIAEE234 pKa = 4.0EE235 pKa = 4.34CAAFDD240 pKa = 3.67EE241 pKa = 4.84CDD243 pKa = 3.66AYY245 pKa = 11.61SDD247 pKa = 4.06VYY249 pKa = 8.78GTNVIDD255 pKa = 4.47IEE257 pKa = 4.25YY258 pKa = 10.62LEE260 pKa = 4.19TKK262 pKa = 10.21YY263 pKa = 11.12ADD265 pKa = 3.59EE266 pKa = 4.38MDD268 pKa = 3.58VAFAEE273 pKa = 4.84VCADD277 pKa = 3.67PSSIPLTTLRR287 pKa = 11.84DD288 pKa = 3.77RR289 pKa = 11.84DD290 pKa = 4.19LVTPDD295 pKa = 3.1NPDD298 pKa = 3.29YY299 pKa = 11.72VFDD302 pKa = 3.95ACC304 pKa = 6.06
MM1 pKa = 7.38KK2 pKa = 10.26LDD4 pKa = 3.61RR5 pKa = 11.84RR6 pKa = 11.84LVACSALVAAAALLGGCASTPATSTATNPSEE37 pKa = 4.48ADD39 pKa = 3.2AGQSDD44 pKa = 3.83AGEE47 pKa = 4.32TRR49 pKa = 11.84TLPTDD54 pKa = 3.33VQADD58 pKa = 3.84YY59 pKa = 11.3QLGGSYY65 pKa = 9.93EE66 pKa = 4.04PPAGVGLVVRR76 pKa = 11.84DD77 pKa = 3.69SGDD80 pKa = 3.42YY81 pKa = 9.68PAEE84 pKa = 3.93GMYY87 pKa = 10.1SICYY91 pKa = 9.74VNGFQTQPQDD101 pKa = 3.22AAVWLAEE108 pKa = 3.98HH109 pKa = 7.33PEE111 pKa = 4.46LILWEE116 pKa = 4.61GGGRR120 pKa = 11.84AEE122 pKa = 4.51GVDD125 pKa = 3.7GAGQPVIDD133 pKa = 4.87PNWPDD138 pKa = 3.7EE139 pKa = 4.44MILDD143 pKa = 4.37TSTEE147 pKa = 4.25SNRR150 pKa = 11.84TAIAEE155 pKa = 4.44VIGEE159 pKa = 4.48TIAQCGEE166 pKa = 3.91RR167 pKa = 11.84GFDD170 pKa = 3.69AVEE173 pKa = 3.82FDD175 pKa = 5.87NLDD178 pKa = 3.29SWSRR182 pKa = 11.84SSGALTLDD190 pKa = 4.03DD191 pKa = 5.23SIALATLLVDD201 pKa = 4.15KK202 pKa = 11.07AADD205 pKa = 3.47AGLAAGQKK213 pKa = 10.2NSAEE217 pKa = 4.01LATRR221 pKa = 11.84GRR223 pKa = 11.84DD224 pKa = 3.15EE225 pKa = 5.27AGFLFAIAEE234 pKa = 4.0EE235 pKa = 4.34CAAFDD240 pKa = 3.67EE241 pKa = 4.84CDD243 pKa = 3.66AYY245 pKa = 11.61SDD247 pKa = 4.06VYY249 pKa = 8.78GTNVIDD255 pKa = 4.47IEE257 pKa = 4.25YY258 pKa = 10.62LEE260 pKa = 4.19TKK262 pKa = 10.21YY263 pKa = 11.12ADD265 pKa = 3.59EE266 pKa = 4.38MDD268 pKa = 3.58VAFAEE273 pKa = 4.84VCADD277 pKa = 3.67PSSIPLTTLRR287 pKa = 11.84DD288 pKa = 3.77RR289 pKa = 11.84DD290 pKa = 4.19LVTPDD295 pKa = 3.1NPDD298 pKa = 3.29YY299 pKa = 11.72VFDD302 pKa = 3.95ACC304 pKa = 6.06
Molecular weight: 32.05 kDa
Isoelectric point according different methods:
Protein with the highest isoelectric point:
>tr|A0A2T0VA62|A0A2T0VA62_9MICO 4-amino-4-deoxychorismate lyase OS=Glaciihabitans tibetensis OX=1266600 GN=B0I08_108159 PE=4 SV=1
MM1 pKa = 7.4GSVIKK6 pKa = 10.42KK7 pKa = 8.47RR8 pKa = 11.84RR9 pKa = 11.84KK10 pKa = 9.22RR11 pKa = 11.84MAKK14 pKa = 9.41KK15 pKa = 9.87KK16 pKa = 9.7HH17 pKa = 5.84RR18 pKa = 11.84KK19 pKa = 8.56LLRR22 pKa = 11.84KK23 pKa = 7.78TRR25 pKa = 11.84HH26 pKa = 3.65QRR28 pKa = 11.84RR29 pKa = 11.84NKK31 pKa = 9.78KK32 pKa = 9.85
MM1 pKa = 7.4GSVIKK6 pKa = 10.42KK7 pKa = 8.47RR8 pKa = 11.84RR9 pKa = 11.84KK10 pKa = 9.22RR11 pKa = 11.84MAKK14 pKa = 9.41KK15 pKa = 9.87KK16 pKa = 9.7HH17 pKa = 5.84RR18 pKa = 11.84KK19 pKa = 8.56LLRR22 pKa = 11.84KK23 pKa = 7.78TRR25 pKa = 11.84HH26 pKa = 3.65QRR28 pKa = 11.84RR29 pKa = 11.84NKK31 pKa = 9.78KK32 pKa = 9.85
Molecular weight: 4.08 kDa
Isoelectric point according different methods:
Peptides (in silico digests for buttom-up proteomics)
Below you can find in silico digests of the whole proteome with Trypsin, Chymotrypsin, Trypsin+LysC, LysN, ArgC proteases suitable for different mass spec machines.| Try ESI |
 |
|---|
| ChTry ESI |
|
|---|
| ArgC ESI |
|
|---|
| LysN ESI |
|
|---|
| TryLysC ESI |
|
|---|
| Try MALDI |
|
|---|
| ChTry MALDI |
|
|---|
| ArgC MALDI |
|
|---|
| LysN MALDI |
|
|---|
| TryLysC MALDI |
|
|---|
| Try LTQ |
|
|---|
| ChTry LTQ |
|
|---|
| ArgC LTQ |
|
|---|
| LysN LTQ |
|
|---|
| TryLysC LTQ |
|
|---|
| Try MSlow |
|
|---|
| ChTry MSlow |
|
|---|
| ArgC MSlow |
|
|---|
| LysN MSlow |
|
|---|
| TryLysC MSlow |
|
|---|
| Try MShigh |
|
|---|
| ChTry MShigh |
|
|---|
| ArgC MShigh |
|
|---|
| LysN MShigh |
|
|---|
| TryLysC MShigh |
|
|---|
General Statistics
Number of major isoforms |
Number of additional isoforms |
Number of all proteins |
Number of amino acids |
Min. Seq. Length |
Max. Seq. Length |
Avg. Seq. Length |
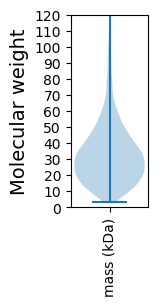
Avg. Mol. Weight |
|---|---|---|---|---|---|---|---|
0 |
1121382 |
29 |
2180 |
324.5 |
34.61 |
Amino acid frequency
Ala |
Cys |
Asp |
Glu |
Phe |
Gly |
His |
Ile |
Lys |
Leu |
|---|---|---|---|---|---|---|---|---|---|
13.143 ± 0.059 | 0.484 ± 0.01 |
5.902 ± 0.04 | 5.428 ± 0.041 |
3.251 ± 0.025 | 8.67 ± 0.033 |
1.864 ± 0.021 | 4.809 ± 0.036 |
2.074 ± 0.03 | 10.139 ± 0.047 |
Met |
Asn |
Gln |
Pro |
Arg |
Ser |
Thr |
Val |
Trp |
Tyr |
|---|---|---|---|---|---|---|---|---|---|
1.768 ± 0.018 | 2.362 ± 0.022 |
5.337 ± 0.033 | 2.792 ± 0.02 |
6.559 ± 0.045 | 6.533 ± 0.033 |
6.516 ± 0.044 | 8.911 ± 0.039 |
1.4 ± 0.017 | 2.059 ± 0.02 |
Most of the basic statistics you can see at this page can be downloaded from this CSV file
See this proteome in:

Proteome-pI is available under Creative Commons Attribution-NoDerivs license, for more details see here
| Reference: Kozlowski LP. Proteome-pI 2.0: Proteome Isoelectric Point Database Update. Nucleic Acids Res. 2021, doi: 10.1093/nar/gkab944 | Contact: Lukasz P. Kozlowski |