Spiroplasma taiwanense CT-1
Taxonomy: cellular organisms; Bacteria; Terrabacteria group; Tenericutes; Mollicutes; Entomoplasmatales; Spiroplasmataceae; Spiroplasma; Spiroplasma taiwanense
Average proteome isoelectric point is 7.03
Get precalculated fractions of proteins
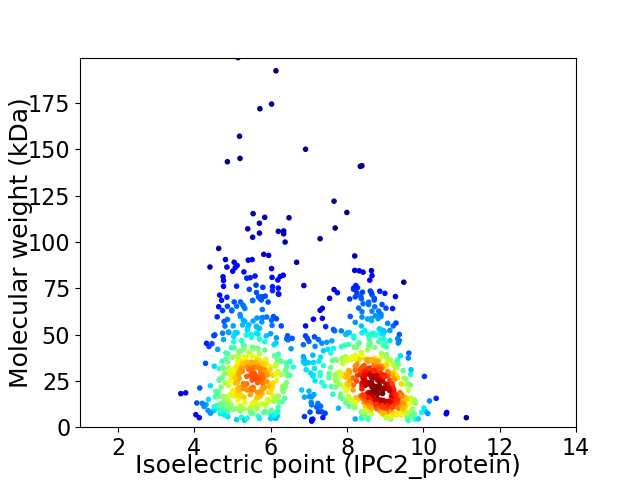
Virtual 2D-PAGE plot for 989 proteins (isoelectric point calculated using IPC2_protein)
Get csv file with sequences according to given criteria:
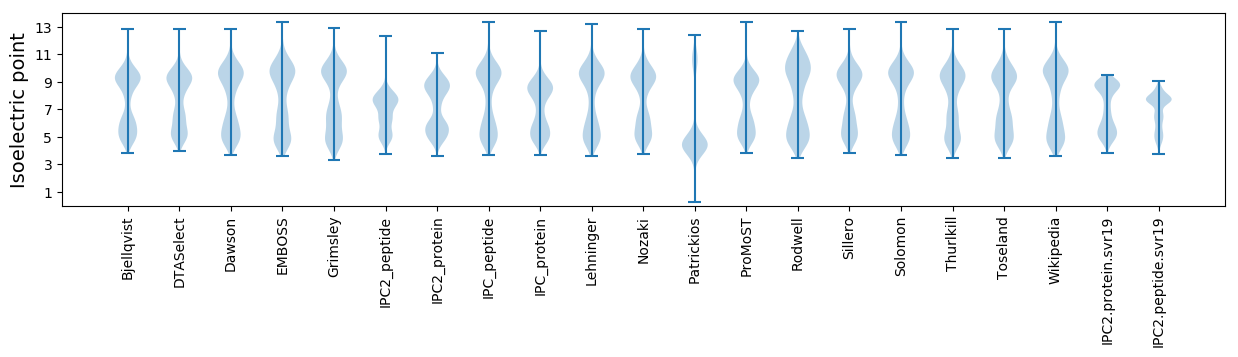
* You can choose from 21 different methods for calculating isoelectric point
Summary statistics related to proteome-wise predictions
Protein with the lowest isoelectric point:
>tr|S5LZW5|S5LZW5_9MOLU Uncharacterized protein OS=Spiroplasma taiwanense CT-1 OX=1276220 GN=STAIW_v1c06490 PE=4 SV=1
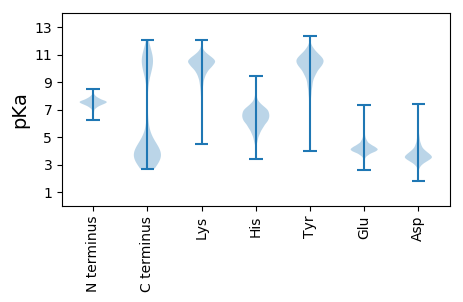
MM1 pKa = 7.67GIIWCDD7 pKa = 3.04EE8 pKa = 3.96SLDD11 pKa = 3.63MNFYY15 pKa = 11.19QNFINVNFLISGIWTDD31 pKa = 3.22RR32 pKa = 11.84YY33 pKa = 10.78SVVFEE38 pKa = 4.28KK39 pKa = 10.61ATVEE43 pKa = 4.02
MM1 pKa = 7.67GIIWCDD7 pKa = 3.04EE8 pKa = 3.96SLDD11 pKa = 3.63MNFYY15 pKa = 11.19QNFINVNFLISGIWTDD31 pKa = 3.22RR32 pKa = 11.84YY33 pKa = 10.78SVVFEE38 pKa = 4.28KK39 pKa = 10.61ATVEE43 pKa = 4.02
Molecular weight: 5.11 kDa
Isoelectric point according different methods:
Protein with the highest isoelectric point:
>tr|S5MDB6|S5MDB6_9MOLU Uncharacterized protein OS=Spiroplasma taiwanense CT-1 OX=1276220 GN=STAIW_v1c11150 PE=4 SV=1
MM1 pKa = 7.32KK2 pKa = 9.47RR3 pKa = 11.84TWQPSKK9 pKa = 10.03IKK11 pKa = 10.14HH12 pKa = 5.53ARR14 pKa = 11.84THH16 pKa = 5.77GFRR19 pKa = 11.84ARR21 pKa = 11.84MVTKK25 pKa = 10.46NGRR28 pKa = 11.84KK29 pKa = 8.88IIKK32 pKa = 9.57ARR34 pKa = 11.84RR35 pKa = 11.84AKK37 pKa = 10.34GRR39 pKa = 11.84AKK41 pKa = 9.64LTAA44 pKa = 4.21
MM1 pKa = 7.32KK2 pKa = 9.47RR3 pKa = 11.84TWQPSKK9 pKa = 10.03IKK11 pKa = 10.14HH12 pKa = 5.53ARR14 pKa = 11.84THH16 pKa = 5.77GFRR19 pKa = 11.84ARR21 pKa = 11.84MVTKK25 pKa = 10.46NGRR28 pKa = 11.84KK29 pKa = 8.88IIKK32 pKa = 9.57ARR34 pKa = 11.84RR35 pKa = 11.84AKK37 pKa = 10.34GRR39 pKa = 11.84AKK41 pKa = 9.64LTAA44 pKa = 4.21
Molecular weight: 5.14 kDa
Isoelectric point according different methods:
Peptides (in silico digests for buttom-up proteomics)
Below you can find in silico digests of the whole proteome with Trypsin, Chymotrypsin, Trypsin+LysC, LysN, ArgC proteases suitable for different mass spec machines.| Try ESI |
 |
|---|
| ChTry ESI |
|
|---|
| ArgC ESI |
|
|---|
| LysN ESI |
|
|---|
| TryLysC ESI |
|
|---|
| Try MALDI |
|
|---|
| ChTry MALDI |
|
|---|
| ArgC MALDI |
|
|---|
| LysN MALDI |
|
|---|
| TryLysC MALDI |
|
|---|
| Try LTQ |
|
|---|
| ChTry LTQ |
|
|---|
| ArgC LTQ |
|
|---|
| LysN LTQ |
|
|---|
| TryLysC LTQ |
|
|---|
| Try MSlow |
|
|---|
| ChTry MSlow |
|
|---|
| ArgC MSlow |
|
|---|
| LysN MSlow |
|
|---|
| TryLysC MSlow |
|
|---|
| Try MShigh |
|
|---|
| ChTry MShigh |
|
|---|
| ArgC MShigh |
|
|---|
| LysN MShigh |
|
|---|
| TryLysC MShigh |
|
|---|
General Statistics
Number of major isoforms |
Number of additional isoforms |
Number of all proteins |
Number of amino acids |
Min. Seq. Length |
Max. Seq. Length |
Avg. Seq. Length |
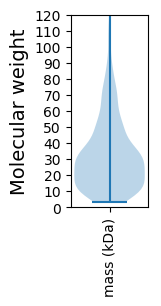
Avg. Mol. Weight |
|---|---|---|---|---|---|---|---|
0 |
294780 |
29 |
1741 |
298.1 |
34.26 |
Amino acid frequency
Ala |
Cys |
Asp |
Glu |
Phe |
Gly |
His |
Ile |
Lys |
Leu |
|---|---|---|---|---|---|---|---|---|---|
4.52 ± 0.077 | 0.672 ± 0.023 |
5.043 ± 0.056 | 7.322 ± 0.074 |
5.829 ± 0.081 | 4.795 ± 0.083 |
1.104 ± 0.028 | 10.92 ± 0.072 |
10.312 ± 0.095 | 9.623 ± 0.075 |
Met |
Asn |
Gln |
Pro |
Arg |
Ser |
Thr |
Val |
Trp |
Tyr |
|---|---|---|---|---|---|---|---|---|---|
2.068 ± 0.033 | 8.077 ± 0.099 |
2.307 ± 0.043 | 3.033 ± 0.043 |
2.671 ± 0.052 | 6.705 ± 0.076 |
4.875 ± 0.055 | 5.206 ± 0.067 |
1.019 ± 0.026 | 3.898 ± 0.059 |
Most of the basic statistics you can see at this page can be downloaded from this CSV file
See this proteome in:

Proteome-pI is available under Creative Commons Attribution-NoDerivs license, for more details see here
| Reference: Kozlowski LP. Proteome-pI 2.0: Proteome Isoelectric Point Database Update. Nucleic Acids Res. 2021, doi: 10.1093/nar/gkab944 | Contact: Lukasz P. Kozlowski |