Dialister sp. CAG:486
Taxonomy: cellular organisms; Bacteria; Terrabacteria group; Firmicutes; Negativicutes; Veillonellales; Veillonellaceae; Dialister; environmental samples
Average proteome isoelectric point is 6.37
Get precalculated fractions of proteins
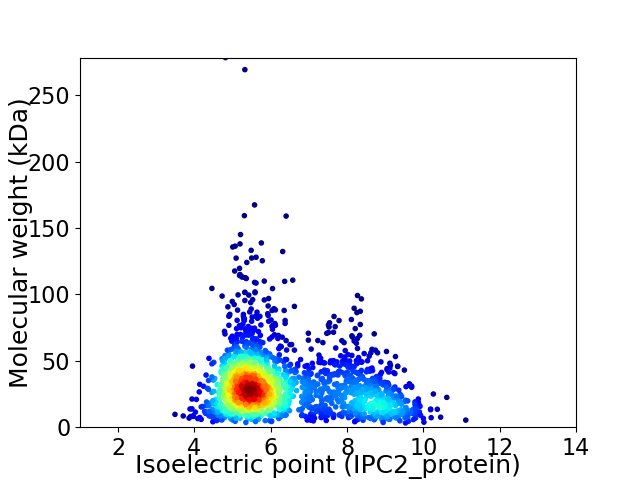
Virtual 2D-PAGE plot for 1926 proteins (isoelectric point calculated using IPC2_protein)
Get csv file with sequences according to given criteria:
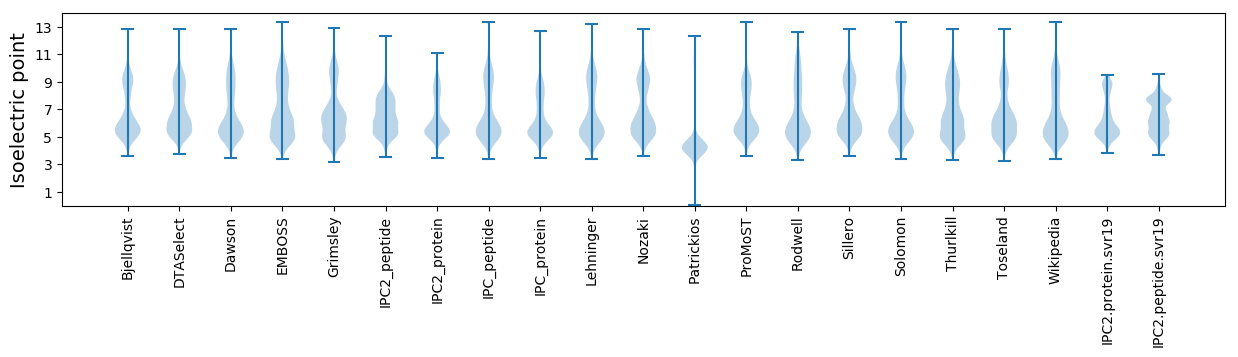
* You can choose from 21 different methods for calculating isoelectric point
Summary statistics related to proteome-wise predictions

Protein with the lowest isoelectric point:
>tr|R6A8G7|R6A8G7_9FIRM Uncharacterized protein OS=Dialister sp. CAG:486 OX=1262870 GN=BN678_01231 PE=3 SV=1
MM1 pKa = 7.31TSASVRR7 pKa = 11.84TDD9 pKa = 3.68FYY11 pKa = 10.73QTFNVEE17 pKa = 4.61GFFSTKK23 pKa = 7.58VTFDD27 pKa = 4.31FIISEE32 pKa = 4.35YY33 pKa = 11.0AADD36 pKa = 3.44LCYY39 pKa = 10.29IIFRR43 pKa = 11.84QISDD47 pKa = 3.51ADD49 pKa = 3.59VSINSCFAA57 pKa = 4.03
MM1 pKa = 7.31TSASVRR7 pKa = 11.84TDD9 pKa = 3.68FYY11 pKa = 10.73QTFNVEE17 pKa = 4.61GFFSTKK23 pKa = 7.58VTFDD27 pKa = 4.31FIISEE32 pKa = 4.35YY33 pKa = 11.0AADD36 pKa = 3.44LCYY39 pKa = 10.29IIFRR43 pKa = 11.84QISDD47 pKa = 3.51ADD49 pKa = 3.59VSINSCFAA57 pKa = 4.03
Molecular weight: 6.5 kDa
Isoelectric point according different methods:
Protein with the highest isoelectric point:
>tr|R6AUQ8|R6AUQ8_9FIRM Signal peptidase I OS=Dialister sp. CAG:486 OX=1262870 GN=BN678_00201 PE=3 SV=1
MM1 pKa = 7.7AKK3 pKa = 7.99MTFQPNNHH11 pKa = 5.63WRR13 pKa = 11.84KK14 pKa = 6.87QTHH17 pKa = 5.61GFRR20 pKa = 11.84ARR22 pKa = 11.84MKK24 pKa = 8.64TKK26 pKa = 10.33AGRR29 pKa = 11.84IVLKK33 pKa = 10.36RR34 pKa = 11.84RR35 pKa = 11.84RR36 pKa = 11.84AKK38 pKa = 9.89GRR40 pKa = 11.84KK41 pKa = 8.67VLSAA45 pKa = 4.05
MM1 pKa = 7.7AKK3 pKa = 7.99MTFQPNNHH11 pKa = 5.63WRR13 pKa = 11.84KK14 pKa = 6.87QTHH17 pKa = 5.61GFRR20 pKa = 11.84ARR22 pKa = 11.84MKK24 pKa = 8.64TKK26 pKa = 10.33AGRR29 pKa = 11.84IVLKK33 pKa = 10.36RR34 pKa = 11.84RR35 pKa = 11.84RR36 pKa = 11.84AKK38 pKa = 9.89GRR40 pKa = 11.84KK41 pKa = 8.67VLSAA45 pKa = 4.05
Molecular weight: 5.35 kDa
Isoelectric point according different methods:
Peptides (in silico digests for buttom-up proteomics)
Below you can find in silico digests of the whole proteome with Trypsin, Chymotrypsin, Trypsin+LysC, LysN, ArgC proteases suitable for different mass spec machines.| Try ESI |
 |
|---|
| ChTry ESI |
|
|---|
| ArgC ESI |
|
|---|
| LysN ESI |
|
|---|
| TryLysC ESI |
|
|---|
| Try MALDI |
|
|---|
| ChTry MALDI |
|
|---|
| ArgC MALDI |
|
|---|
| LysN MALDI |
|
|---|
| TryLysC MALDI |
|
|---|
| Try LTQ |
|
|---|
| ChTry LTQ |
|
|---|
| ArgC LTQ |
|
|---|
| LysN LTQ |
|
|---|
| TryLysC LTQ |
|
|---|
| Try MSlow |
|
|---|
| ChTry MSlow |
|
|---|
| ArgC MSlow |
|
|---|
| LysN MSlow |
|
|---|
| TryLysC MSlow |
|
|---|
| Try MShigh |
|
|---|
| ChTry MShigh |
|
|---|
| ArgC MShigh |
|
|---|
| LysN MShigh |
|
|---|
| TryLysC MShigh |
|
|---|
General Statistics
Number of major isoforms |
Number of additional isoforms |
Number of all proteins |
Number of amino acids |
Min. Seq. Length |
Max. Seq. Length |
Avg. Seq. Length |
Avg. Mol. Weight |
|---|---|---|---|---|---|---|---|
0 |
572162 |
29 |
2613 |
297.1 |
32.99 |
Amino acid frequency
Ala |
Cys |
Asp |
Glu |
Phe |
Gly |
His |
Ile |
Lys |
Leu |
|---|---|---|---|---|---|---|---|---|---|
9.071 ± 0.06 | 1.251 ± 0.023 |
5.677 ± 0.047 | 6.929 ± 0.066 |
4.02 ± 0.044 | 7.664 ± 0.06 |
2.281 ± 0.026 | 6.637 ± 0.049 |
6.36 ± 0.048 | 9.374 ± 0.071 |
Met |
Asn |
Gln |
Pro |
Arg |
Ser |
Thr |
Val |
Trp |
Tyr |
|---|---|---|---|---|---|---|---|---|---|
3.268 ± 0.025 | 3.257 ± 0.047 |
3.91 ± 0.04 | 2.94 ± 0.033 |
5.018 ± 0.045 | 5.731 ± 0.041 |
5.333 ± 0.04 | 6.777 ± 0.049 |
1.036 ± 0.022 | 3.462 ± 0.038 |
Most of the basic statistics you can see at this page can be downloaded from this CSV file
See this proteome in:

Proteome-pI is available under Creative Commons Attribution-NoDerivs license, for more details see here
| Reference: Kozlowski LP. Proteome-pI 2.0: Proteome Isoelectric Point Database Update. Nucleic Acids Res. 2021, doi: 10.1093/nar/gkab944 | Contact: Lukasz P. Kozlowski |